Adaptive Candlestick Pattern Recognition System█ INTRODUCTION
Nearly three years in the making, intermittently worked on in the few spare hours of weekends and time off, this is a passion project I undertook to flesh out my skills as a computer programmer. This script currently recognizes 85 different candlestick patterns ranging from one to five candles in length. It also performs statistical analysis on those patterns to determine prior performance and changes the coloration of those patterns based on that performance. In searching TradingView's script library for scripts similar to this one, I had found a handful. However, when I reviewed the ones which were open source, I did not see many that truly captured the power of PineScrypt or leveraged the way it works to create efficient and reliable code; one of the main driving factors for releasing this 5,000+ line behemoth open sourced.
Please take the time to review this description and source code to utilize this script to its fullest potential.
█ CONCEPTS
This script covers the following topics: Candlestick Theory, Trend Direction, Higher Timeframes, Price Analysis, Statistic Analysis, and Code Design.
Candlestick Theory - This script focuses solely on the concept of Candlestick Theory: arrangements of candlesticks may form certain patterns that can potentially influence the future price action of assets which experience those patterns. A full list of patterns (grouped by pattern length) will be in its own section of this description. This script contains two modes of operation for identifying candlestick patterns, 'CLASSIC' and 'BREAKOUT'.
CLASSIC: In this mode, candlestick patterns will be identified whenever they appear. The user has a wide variety of inputs to manipulate that can change how certain patterns are identified and even enable alerts to notify themselves when these patterns appear. Each pattern selected to appear will have their Profit or Loss (P/L) calculated starting from the first candle open succeeding the pattern to a candle close specified some number of candles ahead. These P/L calculations are then collected for each pattern, and split among partitions of prior price action of the asset the script is currently applied to (more on that in Higher Timeframes ).
BREAKOUT: In this mode, P/L calculations are held off until a breakout direction has been confirmed. The user may specify the number of candles ahead of a pattern's appearance (from one to five) that a pattern has to confirm a breakout in either an upward or downward direction. A breakout is constituted when there is a candle following the appearance of the pattern that closes above/at the highest high of the pattern, or below/at its lowest low. Only then will percent return calculations be performed for the pattern that's been identified, and these percent returns are broken up not only by the partition they had appeared in but also by the breakout direction itself. Patterns which do not breakout in either direction will be ignored, along with having their labels deleted.
In both of these modes, patterns may be overridden. Overrides occur when a smaller pattern has been detected and ends up becoming one (or more) of the candles of a larger pattern. A key example of this would be the Bearish Engulfing and the Three Outside Down patterns. A Three Outside Down necessitates a Bearish Engulfing as the first two candles in it, while the third candle closes lower. When a pattern is overridden, the return for that pattern will no longer be tracked. Overrides will not occur if the tail end of a larger pattern occurs at the beginning of a smaller pattern (Ex: a Bullish Engulfing occurs on the third candle of a Three Outside Down and the candle immediately following that pattern, the Three Outside Down pattern will not be overridden).
Important Functionality Note: These patterns are only searched for at the most recently closed candle, not on the currently closing candle, which creates an offset of one for this script's execution. (SEE LIMITATIONS)
Trend Direction - Many of the patterns require a trend direction prior to their appearance. Noting TradingView's own publication of candlestick patterns, I utilize a similar method for determining trend direction. Moving Averages are used to determine which trend is currently taking place for candlestick patterns to be sought out. The user has access to two Moving Averages which they may individually modify the following for each: Moving Average type (list of 9), their length, width, source values, and all variables associated with two special Moving Averages (Least Squares and Arnaud Legoux).
There are 3 settings for these Moving Averages, the first two switch between the two Moving Averages, and the third uses both. When using individual Moving Averages, the user may select a 'price point' to compare against the Moving Average (default is close). This price point is compared to the Moving Average at the candles prior to the appearance of candle patterns. Meaning: The close compared to the Moving Average two candles behind determines the trend direction used for Candlestick Analysis of one candle patterns; three candles behind for two candle patterns and so on. If the selected price point is above the Moving Average, then the current trend is an 'uptrend', 'downtrend' otherwise.
The third setting using both Moving Averages will compare the lengths of each, and trend direction is determined by the shorter Moving Average compared to the longer one. If the shorter Moving Average is above the longer, then the current trend is an 'uptrend', 'downtrend' otherwise. If the lengths of the Moving Averages are the same, or both Moving Averages are Symmetrical, then MA1 will be used by default. (SEE LIMITATIONS)
Higher Timeframes - This script employs the use of Higher Timeframes with a few request.security calls. The purpose of these calls is strictly for the partitioning of an asset's chart, splitting the returns of patterns into three separate groups. The four inputs in control of this partitioning split the chart based on: A given resolution to grab values from, the length of time in that resolution, and 'Upper' and 'Lower Limits' which split the trading range provided by that length of time in that resolution that forms three separate groups. The default values for these four inputs will partition the current chart by the yearly high-low range where: the 'Upper' partition is the top 20% of that trading range, the 'Middle' partition is 80% to 33% of the trading range, and the 'Lower' partition covers the trading range within 33% of the yearly low.
Patterns which are identified by this script will have their returns grouped together based on which partition they had appeared in. For example, a Bullish Engulfing which occurs within a third of the yearly low will have its return placed separately from a Bullish Engulfing that occurred within 20% of the yearly high. The idea is that certain patterns may perform better or worse depending on when they had occurred during an asset's trading range.
Price Analysis - Price Analysis is a major part of this script's functionality as it can fundamentally change how patterns are shown to the user. The settings related to Price Analysis include setting the number of candles ahead of a pattern's appearance to determine the return of that pattern. In 'BREAKOUT' mode, an additional setting allows the user to specify where the P/L calculation will begin for a pattern that had appeared and confirmed. (SEE LIMITATIONS)
The calculation for percent returns of patterns is illustrated with the following pseudo-code (CLASSIC mode, this is a simplified version of the actual code):
type patternObj
int ID
int partition
type returnsArray
float returns
// No pattern found = na returned
patternObj TEST_VAL = f_FindPattern()
priorTestVal = TEST_VAL
if not na( priorTestVal )
pnlMatrixRow = priorTestVal.ID
pnlMatrixCol = priorTestVal.partition
matrixReturn = matrix.get(PERCENT_RETURNS, pnlMatrixRow, pnlMatrixCol)
percentReturn = ( (close - open ) / open ) * 100%
array.push(matrixReturn.returns, percentReturn)
Statistic Analysis - This script uses Pine's built-in array functions to conduct the Statistic Analysis for patterns. When a pattern is found and its P/L calculation is complete, its return is added to a 'Return Array' User-Defined-Type that contains numerous fields which retain information on a pattern's prior performance. The actual UDT is as follows:
type returnArray
float returns = na
int size = 0
float avg = 0
float median = 0
float stdDev = 0
int polarities = na
All values within this UDT will be updated when a return is added to it (some based on user input). The array.avg , array.median and array.stdev will be ran and saved into their respective fields after a return is placed in the 'returns' array. The 'polarities' integer array is what will be changed based on user input. The user specifies two different percentages that declare 'Positive' and 'Negative' returns for patterns. When a pattern returns above, below, or in between these two values, different indices of this array will be incremented to reflect the kind of return that pattern had just experienced.
These values (plus the full name, partition the pattern occurred in, and a 95% confidence interval of expected returns) will be displayed to the user on the tooltip of the labels that identify patterns. Simply scroll over the pattern label to view each of these values.
Code Design - Overall this script is as much of an art piece as it is functional. Its design features numerous depictions of ASCII Art that illustrate what is being attempted by the functions that identify patterns, and an incalculable amount of time was spent rewriting portions of code to improve its efficiency. Admittedly, this final version is nearly 1,000 lines shorter than a previous version (one which took nearly 30 seconds after compilation to run, and didn't do nearly half of what this version does). The use of UDTs, especially the 'patternObj' one crafted and redesigned from the Hikkake Hunter 2.0 I published last month, played a significant role in making this script run efficiently. There is a slight rigidity in some of this code mainly around pattern IDs which are responsible for displaying the abbreviation for patterns (as well as the full names under the tooltips, and the matrix row position for holding returns), as each is hard-coded to correspond to that pattern.
However, one thing I would like to mention is the extensive use of global variables for pattern detection. Many scripts I had looked over for ideas on how to identify candlestick patterns had the same idea; break the pattern into a set of logical 'true/false' statements derived from historically referencing candle OHLC values. Some scripts which identified upwards of 20 to 30 patterns would reference Pine's built-in OHLC values for each pattern individually, potentially requesting information from TradingView's servers numerous times that could easily be saved into a variable for re-use and only requested once per candle (what this script does).
█ FEATURES
This script features a massive amount of switches, options, floating point values, detection settings, and methods for identifying/tailoring pattern appearances. All modifiable inputs for patterns are grouped together based on the number of candles they contain. Other inputs (like those for statistics settings and coloration) are grouped separately and presented in a way I believe makes the most sense.
Not mentioned above is the coloration settings. One of the aims of this script was to make patterns visually signify their behavior to the user when they are identified. Each pattern has its own collection of returns which are analyzed and compared to the inputs of the user. The user may choose the colors for bullish, neutral, and bearish patterns. They may also choose the minimum number of patterns needed to occur before assigning a color to that pattern based on its behavior; a color for patterns that have not met this minimum number of occurrences yet, and a color for patterns that are still processing in BREAKOUT mode.
There are also an additional three settings which alter the color scheme for patterns: Statistic Point-of-Reference, Adaptive coloring, and Hard Limiting. The Statistic Point-of-Reference decides which value (average or median) will be compared against the 'Negative' and 'Positive Return Tolerance'(s) to guide the coloration of the patterns (or for Adaptive Coloring, the generation of a color gradient).
Adaptive Coloring will have this script produce a gradient that patterns will be colored along. The more bullish or bearish a pattern is, the further along the gradient those patterns will be colored starting from the 'Neutral' color (hard lined at the value of 0%: values above this will be colored bullish, bearish otherwise). When Adaptive Coloring is enabled, this script will request the highest and lowest values (these being the Statistic Point-of-Reference) from the matrix containing all returns and rewrite global variables tied to the negative and positive return tolerances. This means that all patterns identified will be compared with each other to determine bullish/bearishness in Adaptive Coloring.
Hard Limiting will prevent these global variables from being rewritten, so patterns whose Statistic Point-of-Reference exceed the return tolerances will be fully colored the bullish or bearish colors instead of a generated gradient color. (SEE LIMITATIONS)
Apart from the Candle Detection Modes (CLASSIC and BREAKOUT), there's an additional two inputs which modify how this script behaves grouped under a "MASTER DETECTION SETTINGS" tab. These two "Pattern Detection Settings" are 'SWITCHBOARD' and 'TARGET MODE'.
SWITCHBOARD: Every single pattern has a switch that is associated with its detection. When a switch is enabled, the code which searches for that pattern will be run. With the Pattern Detection Setting set to this, all patterns that have their switches enabled will be sought out and shown.
TARGET MODE: There is an additional setting which operates on top of 'SWITCHBOARD' that singles out an individual pattern the user specifies through a drop down list. The names of every pattern recognized by this script will be present along with an identifier that shows the number of candles in that pattern (Ex: " (# candles)"). All patterns enabled in the switchboard will still have their returns measured, but only the pattern selected from the "Target Pattern" list will be shown. (SEE LIMITATIONS)
The vast majority of other features are held in the one, two, and three candle pattern sections.
For one-candle patterns, there are:
3 — Settings related to defining 'Tall' candles:
The number of candles to sample for previous candle-size averages.
The type of comparison done for 'Tall' Candles: Settings are 'RANGE' and 'BODY'.
The 'Tolerance' for tall candles, specifying what percent of the 'average' size candles must exceed to be considered 'Tall'.
When 'Tall Candle Setting' is set to RANGE, the high-low ranges are what the current candle range will be compared against to determine if a candle is 'Tall'. Otherwise the candle bodies (absolute value of the close - open) will be compared instead. (SEE LIMITATIONS)
Hammer Tolerance - How large a 'discarded wick' may be before it disqualifies a candle from being a 'Hammer'.
Discarded wicks are compared to the size of the Hammer's candle body and are dependent upon the body's center position. Hammer bodies closer to the high of the candle will have the upper wick used as its 'discarded wick', otherwise the lower wick is used.
9 — Doji Settings, some pulled from an old Doji Hunter I made a while back:
Doji Tolerance - How large the body of a candle may be compared to the range to be considered a 'Doji'.
Ignore N/S Dojis - Turns off Trend Direction for non-special Dojis.
GS/DF Doji Settings - 2 Inputs that enable and specify how large wicks that typically disqualify Dojis from being 'Gravestone' or 'Dragonfly' Dojis may be.
4 Settings related to 'Long Wick Doji' candles detailed below.
A Tolerance for 'Rickshaw Man' Dojis specifying how close the center of the body must be to the range to be valid.
The 4 settings the user may modify for 'Long Legged' Dojis are: A Sample Base for determining the previous average of wicks, a Sample Length specifying how far back to look for these averages, a Behavior Setting to define how 'Long Legged' Dojis are recognized, and a tolerance to specify how large in comparison to the prior wicks a Doji's wicks must be to be considered 'Long Legged'.
The 'Sample Base' list has two settings:
RANGE: The wicks of prior candles are compared to their candle ranges and the 'wick averages' will be what the average percent of ranges were in the sample.
WICKS: The size of the wicks themselves are averaged and returned for comparing against the current wicks of a Doji.
The 'Behavior' list has three settings:
ONE: Only one wick length needs to exceed the average by the tolerance for a Doji to be considered 'Long Legged'.
BOTH: Both wick lengths need to exceed the average of the tolerance of their respective wicks (upper wicks are compared to upper wicks, lower wicks compared to lower) to be considered 'Long Legged'.
AVG: Both wicks and the averages of the previous wicks are added together, divided by two, and compared. If the 'average' of the current wicks exceeds this combined average of prior wicks by the tolerance, then this would constitute a valid 'Long Legged' Doji. (For Dojis in general - SEE LIMITATIONS)
The final input is one related to candle patterns which require a Marubozu candle in them. The two settings for this input are 'INCLUSIVE' and 'EXCLUSIVE'. If INCLUSIVE is selected, any opening/closing variant of Marubozu candles will be allowed in the patterns that require them.
For two-candle patterns, there are:
2 — Settings which define 'Engulfing' parameters:
Engulfing Setting - Two options, RANGE or BODY which sets up how one candle may 'engulf' the previous.
Inclusive Engulfing - Boolean which enables if 'engulfing' candles can be equal to the values needed to 'engulf' the prior candle.
For the 'Engulfing Setting':
RANGE: If the second candle's high-low range completely covers the high-low range of the prior candle, this is recognized as 'engulfing'.
BODY: If the second candle's open-close completely covers the open-close of the previous candle, this is recognized as 'engulfing'. (SEE LIMITATIONS)
4 — Booleans specifying different settings for a few patterns:
One which allows for 'opens within body' patterns to let the second candle's open/close values match the prior candles' open/close.
One which forces 'Kicking' patterns to have a gap if the Marubozu setting is set to 'INCLUSIVE'.
And Two which dictate if the individual candles in 'Stomach' patterns need to be 'Tall'.
8 — Floating point values which affect 11 different patterns:
One which determines the distance the close of the first candle in a 'Hammer Inverted' pattern must be to the low to be considered valid.
One which affects how close the opens/closes need to be for all 'Lines' patterns (Bull/Bear Meeting/Separating Lines).
One that allows some leeway with the 'Matching Low' pattern (gives a small range the second candle close may be within instead of needing to match the previous close).
Three tolerances for On Neck/In Neck patterns (2 and 1 respectively).
A tolerance for the Thrusting pattern which give a range the close the second candle may be between the midpoint and close of the first to be considered 'valid'.
A tolerance for the two Tweezers patterns that specifies how close the highs and lows of the patterns need to be to each other to be 'valid'.
The first On Neck tolerance specifies how large the lower wick of the first candle may be (as a % of that candle's range) before the pattern is invalidated. The second tolerance specifies how far up the lower wick to the close the second candle's close may be for this pattern. The third tolerance for the In Neck pattern determines how far into the body of the first candle the second may close to be 'valid'.
For the remaining patterns (3, 4, and 5 candles), there are:
3 — Settings for the Deliberation pattern:
A boolean which forces the open of the third candle to gap above the close of the second.
A tolerance which changes the proximity of the third candle's open to the second candle's close in this pattern.
A tolerance that sets the maximum size the third candle may be compared to the average of the first two candles.
One boolean value for the Two Crows patterns (standard and Upside Gapping) that forces the first two candles in the patterns to completely gap if disabled (candle 1's close < candle 2's low).
10 — Floating point values for the remaining patterns:
One tolerance for defining how much the size of each candle in the Identical Black Crows pattern may deviate from the average of themselves to be considered valid.
One tolerance for setting how close the opens/closes of certain three candle patterns may be to each other's opens/closes.*
Three floating point values that affect the Three Stars in the South pattern.
One tolerance for the Side-by-Side patterns - looks at the second and third candle closes.
One tolerance for the Stick Sandwich pattern - looks at the first and third candle closes.
A floating value that sizes the Concealing Baby Swallow pattern's 3rd candle wick.
Two values for the Ladder Bottom pattern which define a range that the third candle's wick size may be.
* This affects the Three Black Crows (non-identical) and Three White Soldiers patterns, each require the opens and closes of every candle to be near each other.
The first tolerance of the Three Stars in the South pattern affects the first candle body's center position, and defines where it must be above to be considered valid. The second tolerance specifies how close the second candle must be to this same position, as well as the deviation the ratio the candle body to its range may be in comparison to the first candle. The third restricts how large the second candle range may be in comparison to the first (prevents this pattern from being recognized if the second candle is similar to the first but larger).
The last two floating point values define upper and lower limits to the wick size of a Ladder Bottom's fourth candle to be considered valid.
█ HOW TO USE
While there are many moving parts to this script, I attempted to set the default values with what I believed may help identify the most patterns within reasonable definitions. When this script is applied to a chart, the Candle Detection Mode (along with the BREAKOUT settings) and all candle switches must be confirmed before patterns are displayed. All switches are on by default, so this gives the user an opportunity to pick which patterns to identify first before playing around in the settings.
All of the settings/inputs described above are meant for experimentation. I encourage the user to tweak these values at will to find which set ups work best for whichever charts they decide to apply these patterns to.
Refer to the patterns themselves during experimentation. The statistic information provided on the tooltips of the patterns are meant to help guide input decisions. The breadth of candlestick theory is deep, and this was an attempt at capturing what I could in its sea of information.
█ LIMITATIONS
DISCLAIMER: While it may seem a bit paradoxical that this script aims to use past performance to potentially measure future results, past performance is not indicative of future results . Markets are highly adaptive and often unpredictable. This script is meant as an informational tool to show how patterns may behave. There is no guarantee that confidence intervals (or any other metric measured with this script) are accurate to the performance of patterns; caution must be exercised with all patterns identified regardless of how much information regarding prior performance is available.
Candlestick Theory - In the name, Candlestick Theory is a theory , and all theories come with their own limits. Some patterns identified by this script may be completely useless/unprofitable/unpredictable regardless of whatever combination of settings are used to identify them. However, if I truly believed this theory had no merit, this script would not exist. It is important to understand that this is a tool meant to be utilized with an array of others to procure positive (or negative, looking at you, short sellers ) results when navigating the complex world of finance.
To address the functionality note however, this script has an offset of 1 by default. Patterns will not be identified on the currently closing candle, only on the candle which has most recently closed. Attempting to have this script do both (offset by one or identify on close) lead to more trouble than it was worth. I personally just want users to be aware that patterns will not be identified immediately when they appear.
Trend Direction - Moving Averages - There is a small quirk with how MA settings will be adjusted if the user inputs two moving averages of the same length when the "MA Setting" is set to 'BOTH'. If Moving Averages have the same length, this script will default to only using MA 1 regardless of if the types of Moving Averages are different . I will experiment in the future to alleviate/reduce this restriction.
Price Analysis - BREAKOUT mode - With how identifying patterns with a look-ahead confirmation works, the percent returns for patterns that break out in either direction will be calculated on the same candle regardless of if P/L Offset is set to 'FROM CONFIRMATION' or 'FROM APPEARANCE'. This same issue is present in the Hikkake Hunter script mentioned earlier. This does not mean the P/L calculations are incorrect , the offset for the calculation is set by the number of candles required to confirm the pattern if 'FROM APPEARANCE' is selected. It just means that these two different P/L calculations will complete at the same time independent of the setting that's been selected.
Adaptive Coloring/Hard Limiting - Hard Limiting is only used with Adaptive Coloring and has no effect outside of it. If Hard Limiting is used, it is recommended to increase the 'Positive' and 'Negative' return tolerance values as a pattern's bullish/bearishness may be disproportionately represented with the gradient generated under a hard limit.
TARGET MODE - This mode will break rules regarding patterns that are overridden on purpose. If a pattern selected in TARGET mode would have otherwise been absorbed by a larger pattern, it will have that pattern's percent return calculated; potentially leading to duplicate returns being included in the matrix of all returns recognized by this script.
'Tall' Candle Setting - This is a wide-reaching setting, as approximately 30 different patterns or so rely on defining 'Tall' candles. Changing how 'Tall' candles are defined whether by the tolerance value those candles need to exceed or by the values of the candle used for the baseline comparison (RANGE/BODY) can wildly affect how this script functions under certain conditions. Refer to the tooltip of these settings for more information on which specific patterns are affected by this.
Doji Settings - There are roughly 10 or so two to three candle patterns which have Dojis as a part of them. If all Dojis are disabled, it will prevent some of these larger patterns from being recognized. This is a dependency issue that I may address in the future.
'Engulfing' Setting - Functionally, the two 'Engulfing' settings are quite different. Because of this, the 'RANGE' setting may cause certain patterns that would otherwise be valid under textbook and online references/definitions to not be recognized as such (like the Upside Gap Two Crows or Three Outside down).
█ PATTERN LIST
This script recognizes 85 patterns upon initial release. I am open to adding additional patterns to it in the future and any comments/suggestions are appreciated. It recognizes:
15 — 1 Candle Patterns
4 Hammer type patterns: Regular Hammer, Takuri Line, Shooting Star, and Hanging Man
9 Doji Candles: Regular Dojis, Northern/Southern Dojis, Gravestone/Dragonfly Dojis, Gapping Up/Down Dojis, and Long-Legged/Rickshaw Man Dojis
White/Black Long Days
32 — 2 Candle Patterns
4 Engulfing type patterns: Bullish/Bearish Engulfing and Last Engulfing Top/Bottom
Dark Cloud Cover
Bullish/Bearish Doji Star patterns
Hammer Inverted
Bullish/Bearish Haramis + Cross variants
Homing Pigeon
Bullish/Bearish Kicking
4 Lines type patterns: Bullish/Bearish Meeting/Separating Lines
Matching Low
On/In Neck patterns
Piercing pattern
Shooting Star (2 Lines)
Above/Below Stomach patterns
Thrusting
Tweezers Top/Bottom patterns
Two Black Gapping
Rising/Falling Window patterns
29 — 3 Candle Patterns
Bullish/Bearish Abandoned Baby patterns
Advance Block
Collapsing Doji Star
Deliberation
Upside/Downside Gap Three Methods patterns
Three Inside/Outside Up/Down patterns (4 total)
Bullish/Bearish Side-by-Side patterns
Morning/Evening Star patterns + Doji variants
Stick Sandwich
Downside/Upside Tasuki Gap patterns
Three Black Crows + Identical variation
Three White Soldiers
Three Stars in the South
Bullish/Bearish Tri-Star patterns
Two Crows + Upside Gap variant
Unique Three River Bottom
3 — 4 Candle Patterns
Concealing Baby Swallow
Bullish/Bearish Three Line Strike patterns
6 — 5 Candle Patterns
Bullish/Bearish Breakaway patterns
Ladder Bottom
Mat Hold
Rising/Falling Three Methods patterns
█ WORKS CITED
Because of the amount of time needed to complete this script, I am unable to provide exact dates for when some of these references were used. I will also not provide every single reference, as citing a reference for each individual pattern and the place it was reviewed would lead to a bibliography larger than this script and its description combined. There were five major resources I used when building this script, one book, two websites (for various different reasons including patterns, moving averages, and various other articles of information), various scripts from TradingView's public library (including TradingView's own source code for *all* candle patterns ), and PineScrypt's reference manual.
Bulkowski, Thomas N. Encyclopedia of Candlestick Patterns . Hoboken, New Jersey: John Wiley & Sons Inc., 2008. E-book (google books).
Various. Numerous webpages. CandleScanner . 2023. online. Accessed 2020 - 2023.
Various. Numerous webpages. Investopedia . 2023. online. Accessed 2020 - 2023.
█ AKNOWLEDGEMENTS
I want to take the time here to thank all of my friends and family, both online and in real life, for the support they've given me over the last few years in this endeavor. My pets who tried their hardest to keep me from completing it. And work for the grit to continue pushing through until this script's completion.
This belongs to me just as much as it does anyone else. Whether you are an institutional trader, gold bug hedging against the dollar, retail ape who got in on a squeeze, or just parents trying to grow their retirement/save for the kids. This belongs to everyone.
Private Beta for new features to be tested can be found here .
Vires In Numeris
ابحث في النصوص البرمجية عن "Pattern recognition"

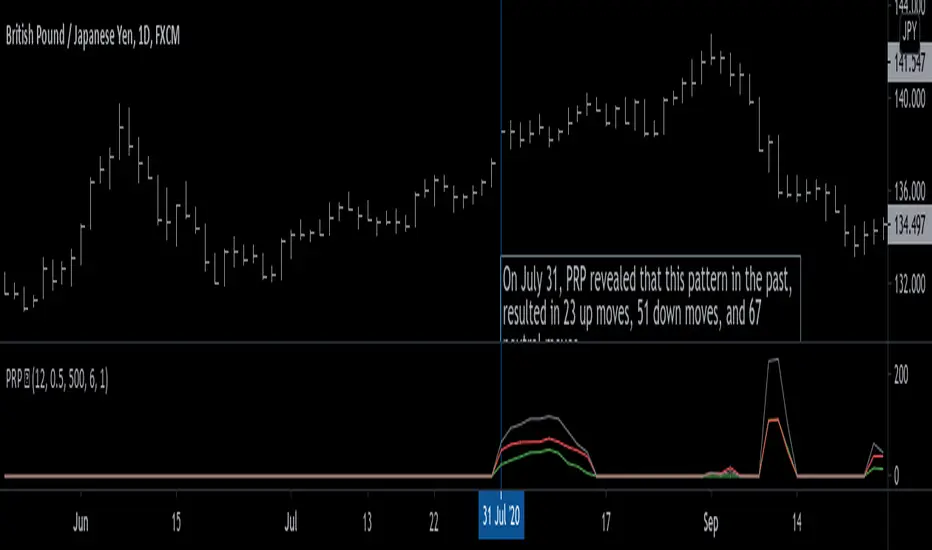
Pattern Recognition Probabilities [racer8]Brief 🌟
Pattern Recognition Probabilities (PRP) is a REALLY smart indicator. It uses the correlation coefficient formula to determine if the current set of bars resembles that of past patterns. It counts the number of times the current pattern has occurred in the past and looks at how it performed historically to determine the probability of an up move, down move, or neutral move.
I'd like to say, I'm proud of this indicator 😆🤙 This is the SMARTEST indicator I have ever made 🧠🧠🧠
Note: PRP doesn't give you actual probabilities, but gives you instead the historical occurrences of up, down, and neutral moves that resulted after the pattern. So you can calculate probabilities based on these valuable statistics. So for example, PRP can tell you this pattern has historically resulted in 55 up moves, 20 down moves, and 60 neutral moves.
Parameters 🌟
You can adjust the Pattern length, Minimum correlation, Statistics lookback, Exit after time, and Atr multiplier parameters.
Pattern length - determines how long the pattern is
Minimum correlation - determines the minimum correlation coefficient needed to pass as a similiar enough pattern.
Statistics lookback - lookback period for gathering all the patterns in the past.
Exit after time - determines when exit occurred (number of periods after pattern) ; is the point that represents the pattern's result.
Atr multiplier - determines minimum atr move needed to qualify whether result was an up/down move or a neutral move. If a particular historical pattern resulted in a move that was less than the min atr, then it is recorded as a neutral move in the statistics.
Thanks for reading! 🙏
Good luck 🍀 Stay safe 😷 Drink lots of water💧
Enjoy! 🥳 and Hit the like button! 👍
SimilarityMeasuresLibrary "SimilarityMeasures"
Similarity measures are statistical methods used to quantify the distance between different data sets
or strings. There are various types of similarity measures, including those that compare:
- data points (SSD, Euclidean, Manhattan, Minkowski, Chebyshev, Correlation, Cosine, Camberra, MAE, MSE, Lorentzian, Intersection, Penrose Shape, Meehl),
- strings (Edit(Levenshtein), Lee, Hamming, Jaro),
- probability distributions (Mahalanobis, Fidelity, Bhattacharyya, Hellinger),
- sets (Kumar Hassebrook, Jaccard, Sorensen, Chi Square).
---
These measures are used in various fields such as data analysis, machine learning, and pattern recognition. They
help to compare and analyze similarities and differences between different data sets or strings, which
can be useful for making predictions, classifications, and decisions.
---
References:
en.wikipedia.org
cran.r-project.org
numerics.mathdotnet.com
github.com
github.com
github.com
Encyclopedia of Distances, doi.org
ssd(p, q)
Sum of squared difference for N dimensions.
Parameters:
p (float ) : `array` Vector with first numeric distribution.
q (float ) : `array` Vector with second numeric distribution.
Returns: Measure of distance that calculates the squared euclidean distance.
euclidean(p, q)
Euclidean distance for N dimensions.
Parameters:
p (float ) : `array` Vector with first numeric distribution.
q (float ) : `array` Vector with second numeric distribution.
Returns: Measure of distance that calculates the straight-line (or Euclidean).
manhattan(p, q)
Manhattan distance for N dimensions.
Parameters:
p (float ) : `array` Vector with first numeric distribution.
q (float ) : `array` Vector with second numeric distribution.
Returns: Measure of absolute differences between both points.
minkowski(p, q, p_value)
Minkowsky Distance for N dimensions.
Parameters:
p (float ) : `array` Vector with first numeric distribution.
q (float ) : `array` Vector with second numeric distribution.
p_value (float) : `float` P value, default=1.0(1: manhatan, 2: euclidean), does not support chebychev.
Returns: Measure of similarity in the normed vector space.
chebyshev(p, q)
Chebyshev distance for N dimensions.
Parameters:
p (float ) : `array` Vector with first numeric distribution.
q (float ) : `array` Vector with second numeric distribution.
Returns: Measure of maximum absolute difference.
correlation(p, q)
Correlation distance for N dimensions.
Parameters:
p (float ) : `array` Vector with first numeric distribution.
q (float ) : `array` Vector with second numeric distribution.
Returns: Measure of maximum absolute difference.
cosine(p, q)
Cosine distance between provided vectors.
Parameters:
p (float ) : `array` 1D Vector.
q (float ) : `array` 1D Vector.
Returns: The Cosine distance between vectors `p` and `q`.
---
angiogenesis.dkfz.de
camberra(p, q)
Camberra distance for N dimensions.
Parameters:
p (float ) : `array` Vector with first numeric distribution.
q (float ) : `array` Vector with second numeric distribution.
Returns: Weighted measure of absolute differences between both points.
mae(p, q)
Mean absolute error is a normalized version of the sum of absolute difference (manhattan).
Parameters:
p (float ) : `array` Vector with first numeric distribution.
q (float ) : `array` Vector with second numeric distribution.
Returns: Mean absolute error of vectors `p` and `q`.
mse(p, q)
Mean squared error is a normalized version of the sum of squared difference.
Parameters:
p (float ) : `array` Vector with first numeric distribution.
q (float ) : `array` Vector with second numeric distribution.
Returns: Mean squared error of vectors `p` and `q`.
lorentzian(p, q)
Lorentzian distance between provided vectors.
Parameters:
p (float ) : `array` Vector with first numeric distribution.
q (float ) : `array` Vector with second numeric distribution.
Returns: Lorentzian distance of vectors `p` and `q`.
---
angiogenesis.dkfz.de
intersection(p, q)
Intersection distance between provided vectors.
Parameters:
p (float ) : `array` Vector with first numeric distribution.
q (float ) : `array` Vector with second numeric distribution.
Returns: Intersection distance of vectors `p` and `q`.
---
angiogenesis.dkfz.de
penrose(p, q)
Penrose Shape distance between provided vectors.
Parameters:
p (float ) : `array` Vector with first numeric distribution.
q (float ) : `array` Vector with second numeric distribution.
Returns: Penrose shape distance of vectors `p` and `q`.
---
angiogenesis.dkfz.de
meehl(p, q)
Meehl distance between provided vectors.
Parameters:
p (float ) : `array` Vector with first numeric distribution.
q (float ) : `array` Vector with second numeric distribution.
Returns: Meehl distance of vectors `p` and `q`.
---
angiogenesis.dkfz.de
edit(x, y)
Edit (aka Levenshtein) distance for indexed strings.
Parameters:
x (int ) : `array` Indexed array.
y (int ) : `array` Indexed array.
Returns: Number of deletions, insertions, or substitutions required to transform source string into target string.
---
generated description:
The Edit distance is a measure of similarity used to compare two strings. It is defined as the minimum number of
operations (insertions, deletions, or substitutions) required to transform one string into another. The operations
are performed on the characters of the strings, and the cost of each operation depends on the specific algorithm
used.
The Edit distance is widely used in various applications such as spell checking, text similarity, and machine
translation. It can also be used for other purposes like finding the closest match between two strings or
identifying the common prefixes or suffixes between them.
---
github.com
www.red-gate.com
planetcalc.com
lee(x, y, dsize)
Distance between two indexed strings of equal length.
Parameters:
x (int ) : `array` Indexed array.
y (int ) : `array` Indexed array.
dsize (int) : `int` Dictionary size.
Returns: Distance between two strings by accounting for dictionary size.
---
www.johndcook.com
hamming(x, y)
Distance between two indexed strings of equal length.
Parameters:
x (int ) : `array` Indexed array.
y (int ) : `array` Indexed array.
Returns: Length of different components on both sequences.
---
en.wikipedia.org
jaro(x, y)
Distance between two indexed strings.
Parameters:
x (int ) : `array` Indexed array.
y (int ) : `array` Indexed array.
Returns: Measure of two strings' similarity: the higher the value, the more similar the strings are.
The score is normalized such that `0` equates to no similarities and `1` is an exact match.
---
rosettacode.org
mahalanobis(p, q, VI)
Mahalanobis distance between two vectors with population inverse covariance matrix.
Parameters:
p (float ) : `array` 1D Vector.
q (float ) : `array` 1D Vector.
VI (matrix) : `matrix` Inverse of the covariance matrix.
Returns: The mahalanobis distance between vectors `p` and `q`.
---
people.revoledu.com
stat.ethz.ch
docs.scipy.org
fidelity(p, q)
Fidelity distance between provided vectors.
Parameters:
p (float ) : `array` 1D Vector.
q (float ) : `array` 1D Vector.
Returns: The Bhattacharyya Coefficient between vectors `p` and `q`.
---
en.wikipedia.org
bhattacharyya(p, q)
Bhattacharyya distance between provided vectors.
Parameters:
p (float ) : `array` 1D Vector.
q (float ) : `array` 1D Vector.
Returns: The Bhattacharyya distance between vectors `p` and `q`.
---
en.wikipedia.org
hellinger(p, q)
Hellinger distance between provided vectors.
Parameters:
p (float ) : `array` 1D Vector.
q (float ) : `array` 1D Vector.
Returns: The hellinger distance between vectors `p` and `q`.
---
en.wikipedia.org
jamesmccaffrey.wordpress.com
kumar_hassebrook(p, q)
Kumar Hassebrook distance between provided vectors.
Parameters:
p (float ) : `array` 1D Vector.
q (float ) : `array` 1D Vector.
Returns: The Kumar Hassebrook distance between vectors `p` and `q`.
---
github.com
jaccard(p, q)
Jaccard distance between provided vectors.
Parameters:
p (float ) : `array` 1D Vector.
q (float ) : `array` 1D Vector.
Returns: The Jaccard distance between vectors `p` and `q`.
---
github.com
sorensen(p, q)
Sorensen distance between provided vectors.
Parameters:
p (float ) : `array` 1D Vector.
q (float ) : `array` 1D Vector.
Returns: The Sorensen distance between vectors `p` and `q`.
---
people.revoledu.com
chi_square(p, q, eps)
Chi Square distance between provided vectors.
Parameters:
p (float ) : `array` 1D Vector.
q (float ) : `array` 1D Vector.
eps (float)
Returns: The Chi Square distance between vectors `p` and `q`.
---
uw.pressbooks.pub
stats.stackexchange.com
www.itl.nist.gov
kulczynsky(p, q, eps)
Kulczynsky distance between provided vectors.
Parameters:
p (float ) : `array` 1D Vector.
q (float ) : `array` 1D Vector.
eps (float)
Returns: The Kulczynsky distance between vectors `p` and `q`.
---
github.com

Lorentzian Classification - Advanced Trading DashboardLorentzian Classification - Relativistic Market Analysis
A Journey from Theory to Trading Reality
What began as fascination with Einstein's relativity and Lorentzian geometry has evolved into a practical trading tool that bridges theoretical physics and market dynamics. This indicator represents months of wrestling with complex mathematical concepts, debugging intricate algorithms, and transforming abstract theory into actionable trading signals.
The Theoretical Foundation
Lorentzian Distance in Market Space
Traditional Euclidean distance treats all feature differences equally, but markets don't behave uniformly. Lorentzian distance, borrowed from spacetime geometry, provides a more nuanced similarity measure:
d(x,y) = Σ ln(1 + |xi - yi|)
This logarithmic formulation naturally handles:
Scale invariance: Large price moves don't overwhelm small but significant patterns
Outlier robustness: Extreme values are dampened rather than dominating
Non-linear relationships: Captures market behavior better than linear metrics
K-Nearest Neighbors with Relativistic Weighting
The algorithm searches historical market states for patterns similar to current conditions. Each neighbor receives weight inversely proportional to its Lorentzian distance:
w = 1 / (1 + distance)
This creates a "gravitational" effect where closer patterns have stronger influence on predictions.
The Implementation Challenge
Creating meaningful market features required extensive experimentation:
Price Features: Multi-timeframe momentum (1, 2, 3, 5, 8 bar lookbacks) Volume Features: Relative volume analysis against 20-period average
Volatility Features: ATR and Bollinger Band width normalization Momentum Features: RSI deviation from neutral and MACD/price ratio
Each feature undergoes min-max normalization to ensure equal weighting in distance calculations.
The Prediction Mechanism
For each current market state:
Feature Vector Construction: 12-dimensional representation of market conditions
Historical Search: Scan lookback period for similar patterns using Lorentzian distance
Neighbor Selection: Identify K nearest historical matches
Outcome Analysis: Examine what happened N bars after each match
Weighted Prediction: Combine outcomes using distance-based weights
Confidence Calculation: Measure agreement between neighbors
Technical Hurdles Overcome
Array Management: Complex indexing to prevent look-ahead bias
Distance Calculations: Optimizing nested loops for performance
Memory Constraints: Balancing lookback depth with computational limits
Signal Filtering: Preventing clustering of identical signals
Advanced Dashboard System
Main Control Panel
The primary dashboard provides real-time market intelligence:
Signal Status: Current prediction with confidence percentage
Neighbor Analysis: How many historical patterns match current conditions
Market Regime: Trend strength, volatility, and volume analysis
Temporal Context: Real-time updates with timestamp
Performance Analytics
Comprehensive tracking system monitors:
Win Rate: Percentage of successful predictions
Signal Count: Total predictions generated
Streak Analysis: Current winning/losing sequence
Drawdown Monitoring: Maximum equity decline
Sharpe Approximation: Risk-adjusted performance estimate
Risk Assessment Panel
Multi-dimensional risk analysis:
RSI Positioning: Overbought/oversold conditions
ATR Percentage: Current volatility relative to price
Bollinger Position: Price location within volatility bands
MACD Alignment: Momentum confirmation
Confidence Heatmap
Visual representation of prediction reliability:
Historical Confidence: Last 10 periods of prediction certainty
Strength Analysis: Magnitude of prediction values over time
Pattern Recognition: Color-coded confidence levels for quick assessment
Input Parameters Deep Dive
Core Algorithm Settings
K Nearest Neighbors (1-20): More neighbors create smoother but less responsive signals. Optimal range 5-8 for most markets.
Historical Lookback (50-500): Deeper history improves pattern recognition but reduces adaptability. 100-200 bars optimal for most timeframes.
Feature Window (5-30): Longer windows capture more context but reduce sensitivity. Match to your trading timeframe.
Feature Selection
Price Changes: Essential for momentum and reversal detection Volume Profile: Critical for institutional activity recognition Volatility Measures: Key for regime change detection Momentum Indicators: Vital for trend confirmation
Signal Generation
Prediction Horizon (1-20): How far ahead to predict. Shorter horizons for scalping, longer for swing trading.
Signal Threshold (0.5-0.9): Confidence required for signal generation. Higher values reduce false signals but may miss opportunities.
Smoothing (1-10): EMA applied to raw predictions. More smoothing reduces noise but increases lag.
Visual Design Philosophy
Color Themes
Professional: Corporate blue/red for institutional environments Neon: Cyberpunk cyan/magenta for modern aesthetics
Matrix: Green/red hacker-inspired palette Classic: Traditional trading colors
Information Hierarchy
The dashboard system prioritizes information by importance:
Primary Signals: Largest, most prominent display
Confidence Metrics: Secondary but clearly visible
Supporting Data: Detailed but unobtrusive
Historical Context: Available but not distracting
Trading Applications
Signal Interpretation
Long Signals: Prediction > threshold with high confidence
Look for volume confirmation
- Check trend alignment
- Verify support levels
Short Signals: Prediction < -threshold with high confidence
Confirm with resistance levels
- Check for distribution patterns
- Verify momentum divergence
- Market Regime Adaptation
Trending Markets: Higher confidence in directional signals
Ranging Markets: Focus on reversal signals at extremes
Volatile Markets: Require higher confidence thresholds
Low Volume: Reduce position sizes, increase caution
Risk Management Integration
Confidence-Based Sizing: Larger positions for higher confidence signals
Regime-Aware Stops: Wider stops in volatile regimes
Multi-Timeframe Confirmation: Align signals across timeframes
Volume Confirmation: Require volume support for major signals
Originality and Innovation
This indicator represents genuine innovation in several areas:
Mathematical Approach
First application of Lorentzian geometry to market pattern recognition. Unlike Euclidean-based systems, this naturally handles market non-linearities.
Feature Engineering
Sophisticated multi-dimensional feature space combining price, volume, volatility, and momentum in normalized form.
Visualization System
Professional-grade dashboard system providing comprehensive market intelligence in intuitive format.
Performance Tracking
Real-time performance analytics typically found only in institutional trading systems.
Development Journey
Creating this indicator involved overcoming numerous technical challenges:
Mathematical Complexity: Translating theoretical concepts into practical code
Performance Optimization: Balancing accuracy with computational efficiency
User Interface Design: Making complex data accessible and actionable
Signal Quality: Filtering noise while maintaining responsiveness
The result is a tool that brings institutional-grade analytics to individual traders while maintaining the theoretical rigor of its mathematical foundation.
Best Practices
- Parameter Optimization
- Start with default settings and adjust based on:
Market Characteristics: Volatile vs. stable
Trading Timeframe: Scalping vs. swing trading
Risk Tolerance: Conservative vs. aggressive
Signal Confirmation
Never trade on Lorentzian signals alone:
Price Action: Confirm with support/resistance
Volume: Verify with volume analysis
Multiple Timeframes: Check higher timeframe alignment
Market Context: Consider overall market conditions
Risk Management
Position Sizing: Scale with confidence levels
Stop Losses: Adapt to market volatility
Profit Targets: Based on historical performance
Maximum Risk: Never exceed 2-3% per trade
Disclaimer
This indicator is for educational and research purposes only. It does not constitute financial advice or guarantee profitable trading results. The Lorentzian classification system reveals market patterns but cannot predict future price movements with certainty. Always use proper risk management, conduct your own analysis, and never risk more than you can afford to lose.
Market dynamics are inherently uncertain, and past performance does not guarantee future results. This tool should be used as part of a comprehensive trading strategy, not as a standalone solution.
Bringing the elegance of relativistic geometry to market analysis through sophisticated pattern recognition and intuitive visualization.
Thank you for sharing the idea. You're more than a follower, you're a leader!
@vasanthgautham1221
Trade with precision. Trade with insight.
— Dskyz , for DAFE Trading Systems

MTF Fibonacci Pivots with Mandelbrot FractalsMTF Fibonacci Pivots with Mandelbrot Fractals: Advanced Market Structure Analysis
Overview
The MTF Fibonacci Pivots with Mandelbrot Fractals indicator represents a significant advancement in technical analysis by combining multi-timeframe Fibonacci pivot levels with sophisticated fractal pattern recognition. This powerful tool identifies key support and resistance zones while predicting potential price reversals with remarkable accuracy.
Key Capabilities
This indicator provides traders with three distinct layers of market structure analysis:
Automatic Timeframe Adaptation: The primary pivot set automatically adjusts to your chart's timeframe, ensuring relevant support and resistance levels for your specific trading horizon.
1-Year Fibonacci Pivots: The second layer displays yearly pivots that reveal long-term market cycles and institutional price levels that often act as significant reversal points.
3-Year Fibonacci Pivots: The third layer unveils major market structure zones that typically remain relevant for extended periods, offering strategic context for position trading and long-term investment decisions.
Predictive Technology
What truly distinguishes this indicator is its advanced predictive capability powered by:
Mandelbrot Fractal Pattern Recognition: The indicator implements a sophisticated fractal detection algorithm that identifies recurring price patterns across multiple timeframes. Unlike conventional fractal indicators, it incorporates noise filtering and adaptive sensitivity to market volatility.
Tesla's 3-6-9 Principle Integration: The system incorporates Nikola Tesla's mathematical principle through a cubic Mandelbrot equation (Z_{n+1} = Z_n^3 + C where Z_0 = 0), creating a unique approach to pattern recognition that aligns with natural market rhythms.
Historical Pattern Matching: When a current price pattern exhibits strong similarity to historical formations, the indicator generates predictive targets with confidence ratings. Each prediction undergoes rigorous validation against multiple parameters including trend alignment, volatility context, and mathematical coherence.
Visual Intelligence System
The indicator's visual presentation enhances trading decision-making through:
Confidence-Based Visualization: Predictions display with intuitive star ratings, percentage confidence scores, and contextual information including price movement magnitude and estimated time to target.
Adaptive Color Harmonization: The color system intelligently adjusts to provide optimal visibility while maintaining a professional appearance suitable for any chart setup.
Trend Alignment Indicators: Each prediction includes references to the broader trend context, helping traders avoid counter-trend trades unless the reversal signal carries exceptional strength.
Strategic Applications
This indicator excels in multiple trading scenarios:
Intraday Trading: Identify high-probability reversal zones with precise timing
Swing Trading: Anticipate significant market turns at key structural levels
Position Trading: Recognize major cycle shifts for strategic entry and exit
The automatic 1-year and 3-year Fibonacci pivots provide institutional-grade reference points that typically define major market movements. These longer timeframes reveal critical zones that might be invisible on shorter-term analysis, giving you a significant edge in understanding where price is likely to encounter substantial buying or selling pressure.
This innovative approach to market analysis combines classical Fibonacci mathematics with cutting-edge fractal theory to create a comprehensive market structure visualization system that illuminates both present support/resistance levels and future price targets with exceptional clarity.
Setting Up MTF Fibonacci Pivots with Mandelbrot Fractals
Initial Setup
Adding this indicator to your TradingView charts is straightforward:
Navigate to the "Indicators" button on your chart toolbar
Search for "MTF Fibonacci Pivots with Mandelbrot Fractals"
Select the indicator to add it to your chart
A configuration panel will appear with various setting categories
Recommended Settings
The indicator comes pre-configured with optimal default settings, but you may want to adjust them based on your trading style:
For Day Trading (Timeframes 1-minute to 1-hour)
Pivots Timeframe 1: Auto (automatically adapts to your chart)
Pivots Timeframe 2: Daily
Pivots Timeframe 3: Weekly
Fractal Sensitivity: 2-3
Fractal Lookback Period: 20
Prediction Strength: 2
Color Theme: High Contrast or Dark Mode
For Swing Trading (Timeframes 4-hour to Daily)
Pivots Timeframe 1: Daily
Pivots Timeframe 2: Weekly
Pivots Timeframe 3: Monthly
Fractal Sensitivity: 1-2
Fractal Lookback Period: 30
Prediction Strength: 2-3
Color Theme: Default or Dimmed
For Position Trading (Timeframes Daily to Weekly)
Pivots Timeframe 1: Weekly
Pivots Timeframe 2: Monthly
Pivots Timeframe 3: Quarterly
Fractal Sensitivity: 1
Fractal Lookback Period: 50
Prediction Strength: 1
Color Theme: Monochrome or Pastel
Restoring Default Settings
If you've adjusted settings and wish to return to the defaults:
Right-click on the indicator name on your chart
Select "Settings" from the context menu
In the settings dialog, look for the "Reset All" button at the bottom
Confirm the reset when prompted
Alternatively, you can remove the indicator and add it again for a fresh start with default settings.
Advanced Settings Guidance
Visual Appearance
Use Gradient Colors: Enable for better visual differentiation between pivot levels
Color Transparency: 15% provides an optimal balance between visibility and chart clutter
Line Width: 1-2 for cleaner charts, 3+ for enhanced visibility
Fractal Analysis
Enable Fractal Analysis: Keep enabled for prediction capabilities
Fractal Box Spacing: Higher values (5-10) for cleaner displays, lower values (1-3) for more signals
Maximum Forecast Bars: 20 is optimal for most timeframes, adjust higher for longer predictions
Performance Considerations
Enable Self-Optimization: Keep enabled to maintain smooth chart performance
Resource Priority: Use "Balanced" for most computers, "Performance" for older systems
Force Pivot Display: Enable only when checking specific historical periods
Common Setup Mistakes to Avoid
Setting all timeframes too close together (e.g., Daily, Daily, Weekly) reduces the multi-timeframe advantage
Using high fractal sensitivity (4+) on noisy markets creates excessive signals
Setting fractal box spacing too low causes cluttered prediction boxes
Disabling self-optimization may cause performance issues on complex charts
Using incompatible color themes for your chart background reduces visibility
The indicator's power comes from its default 1-year and 3-year Fibonacci pivot settings, which highlight institutional levels while the auto-timeframe setting adapts to your trading horizon. These carefully balanced defaults provide an excellent starting point for most traders.
For optimal results, I recommend making minimal adjustments at first, then gradually customizing settings as you become familiar with the indicator's behavior in your specific markets and timeframes.
Screenshots:

Chart Patterns [ActiveQuants]The Chart Patterns indicator is a comprehensive tool designed to automatically identify a variety of common chart patterns directly on your price chart. By detecting sequences of pivot highs and lows , this indicator helps traders spot potential trend continuations , reversals , and key market structures such as Double Tops and Double Bottoms . Enhance your technical analysis by quickly recognizing these formations as they emerge.
How It Works
The indicator operates in a two-stage process:
Pivot Point Detection: It first identifies significant swing highs and swing lows (pivot points) based on a user-defined Period . These pivots form the fundamental building blocks for pattern recognition.
Pattern Recognition: Using the sequence of these detected pivot points, the script then applies logical rules to identify the following patterns:
Lower Low (LL)
Lower Low & Lower High (LL & LH)
Higher High (HH)
Higher High & Higher Low (HH & HL)
Double Tops
Double Bottoms
Patterns are drawn on the chart with connecting lines and labeled for easy identification. Double Tops and Double Bottoms also feature a status system: " Active " while forming, " Confirmed " upon neckline breakout, or " Invalid " if specific conditions negate the pattern before confirmation.
█ KEY FEATURES
Comprehensive Pattern Detection: Identifies six distinct types of chart patterns, offering insights into both trend continuation and potential reversals.
Pivot-Based Analysis: Uses a robust method of identifying pivot highs and lows as the foundation for pattern formation.
Pattern Status for Double Tops/Bottoms:
- Active: A Double Top or Double Bottom pattern has formed its two peaks/troughs and the intervening neckline point, but the price has not yet broken beyond the neckline. The pattern is developing .
- Confirmed: The price has decisively closed beyond the neckline (below for Double Top, above for Double Bottom), signaling a potential entry or validation of the pattern.
- Invalid: An " Active " Double Top or Double Bottom pattern can be invalidated if, before a neckline breakout occurs, a new pivot point forms that negates the pattern’s structural integrity. For example, if a new pivot low forms above or at the neckline of an Active Double Top, the pattern is considered invalid because the market failed to break down and instead showed relative strength.
Customizable Visuals: Allows users to define colors for bullish and bearish patterns, line widths, and the visibility of pivot points.
Selective Pattern Display: Users can choose to display all patterns or filter by status (Active, Confirmed, Invalid) for Double Tops/Bottoms. Individual pattern types can also be toggled on or off.
Historical Analysis Control: The Show Last History (Bars) input allows users to specify how far back the indicator should plot patterns, optimizing performance and chart readability.
Clear Labeling: Patterns are clearly labeled on the chart, with Double Tops/Bottoms also showing " Top 1 ," " Top 2 ," or " Bottom 1 ," " Bottom 2 " labels.
█ PATTERNS DETECTED
Lower Low (LL): Indicates a potential bearish continuation or the start of a downtrend. Forms when price makes a lower low during an uptrend.
Lower Low & Lower High (LL & LH): A stronger confirmation of a bearish trend, where the market forms a lower low followed by a lower high .
Higher High (HH): Signals a potential bullish continuation or the start of an uptrend. Forms when price makes a higher high during a downtrend.
Higher High & Higher Low (HH & HL): A stronger confirmation of a bullish trend, where the market forms a higher high followed by a higher low .
Double Top: A bearish reversal pattern characterized by two distinct peaks at roughly the same price level, separated by a trough (neckline). Confirmation occurs when price breaks below the neckline.
Double Bottom: A bullish reversal pattern featuring two distinct troughs at roughly the same price level, separated by a peak (neckline). Confirmation occurs when price breaks above the neckline.
█ EXAMPLE: DOUBLE TOP INVALIDATION
Understanding how a Double Top or Double Bottom can be invalidated is crucial. Here's an example for a Double Top:
Formation: The indicator identifies two peaks (Top 1, Top 2) at a similar price level, with a corrective trough (Neckline Pivot P5) in between. The pattern is labeled " Double Top " and is in an " Active " state. ( Imagine points P4 and P6 are the two tops, and P5 is the low point of the neckline between them ).
Pre-Breakout Condition: The price action continues, but before it breaks decisively below the P5 neckline level, a new significant swing low (a new pivot low) forms.
Invalidation Check: The indicator checks the price level of this new pivot low. If this new pivot low occurs at a price equal to or higher than the P5 neckline level, the " Active " Double Top pattern is re-labeled as " Invalid Double Top ". ( See image below for a visual representation of this scenario )
In this example, the Double Top formed with Top 1 (P4) and Top 2 (P6). The neckline is at P5. Before price broke below P5, a new pivot low formed at the red circle. Since this new pivot low is above the P5 neckline, the Double Top is marked " Invalid ".
The logic is that the market failed to break the neckline support and instead established a higher low (or a low at the support level), suggesting that the immediate bearish pressure has waned, thus invalidating the bearish reversal implication of the Double Top before it could confirm. A similar logic applies to Double Bottoms (a new pivot high forming below or at the neckline before an upside breakout).
█ USER INPUTS
Visibility and Common Styling
- Show Last History (Bars):
Specifies the number of recent bars the indicator will analyze and plot patterns on.
Default: 3000 bars. Min: 10.
- Patterns:
Filters which patterns are displayed based on their status.
Options: All, Active, Confirmed, Invalid.
Default: All.
- Pattern Line Width:
Sets the thickness of the lines used to draw the patterns.
Default: 1. Min: 1, Max: 10.
- Bearish Color:
Color for bearish patterns (LL, LL & LH, Double Tops).
Default: Red.
- Bullish Color:
Color for bullish patterns (HH, HH & HL, Double Bottoms).
Default: Green.
Pivot Points
- Period:
The lookback period on either side of a bar to qualify it as a pivot high or low. Higher values detect more significant pivots.
Default: 10 bars. Min: 2.
- Show Pivot Highs:
Toggles the visibility of detected pivot high markers.
Default: Enabled.
- Show Pivot Lows:
Toggles the visibility of detected pivot low markers.
Default: Enabled.
- Pivot Highs Color:
Color for the pivot high markers.
Default: #ff5252 (Reddish).
- Pivot Lows Color:
Color for the pivot low markers.
Default: #089981 (Greenish).
Patterns (Toggles)
- Lower Low:
Enable/disable detection and display of Lower Low patterns.
Default: Enabled.
- Lower Low & Lower High:
Enable/disable detection and display of Lower Low & Lower High patterns.
Default: Enabled.
- Higher High:
Enable/disable detection and display of Higher High patterns.
Default: Enabled.
- Higher High & Higher Low:
Enable/disable detection and display of Higher High & Higher Low patterns.
Default: Enabled.
- Double Tops:
Enable/disable detection and display of Double Top patterns.
Default: Enabled.
- Double Bottoms:
Enable/disable detection and display of Double Bottom patterns.
Default: Enabled.
█ CONCLUSION
The Chart Patterns indicator is a versatile and powerful assistant for traders who utilize classical chart pattern analysis. By automating the detection of key formations and providing clear visual cues along with status updates for patterns like Double Tops and Bottoms, it allows traders to focus on strategy development and execution. With its customizable settings, it can be adapted to various instruments and timeframes, making it a valuable addition to any technical trader's toolkit.
█ IMPORTANT NOTES
⚠ Pivot Period Sensitivity: The Period setting for pivot detection is crucial. A shorter period will identify more frequent, smaller swings, while a longer period will focus on more significant turning points. Adjust this setting based on the asset's volatility, the timeframe you are trading and your trading style.
⚠ Confirmation is Key: While the indicator identifies patterns, always wait for pattern confirmation (e.g., neckline breaks for Double Tops/Bottoms) and consider other factors like volume and market context before making trading decisions.
⚠ Confirmed Bars for Detection: Patterns are identified based on confirmed pivot points, which means a pivot is recognized period bars after it has formed. Status updates for Double Tops/Bottoms (Active, Confirmed, Invalid) also occur on confirmed bars. This approach enhances reliability and reduces the likelihood of repainting based on intra-bar price fluctuations.
⚠ Not a Standalone System: Chart patterns provide valuable insights, but they should be used in conjunction with other technical analysis tools (e.g., trendlines, moving averages, oscillators) and a sound risk management plan.
⚠ Lagging Nature: By their very definition, chart patterns are lagging indicators as they require a sequence of price action and several pivot points to complete their formation.
█ RISK DISCLAIMER
Trading involves a substantial risk of loss and is not suitable for every investor. The information provided by the Chart Patterns indicator is for educational and informational purposes only. It should not be considered as financial advice or a recommendation to buy or sell any security. Chart patterns indicate potential price movements but do not guarantee future results. Always perform your own due diligence and consult with a qualified financial advisor before making any investment decisions. Past performance is not indicative of future results.
📈 Happy trading! 🚀

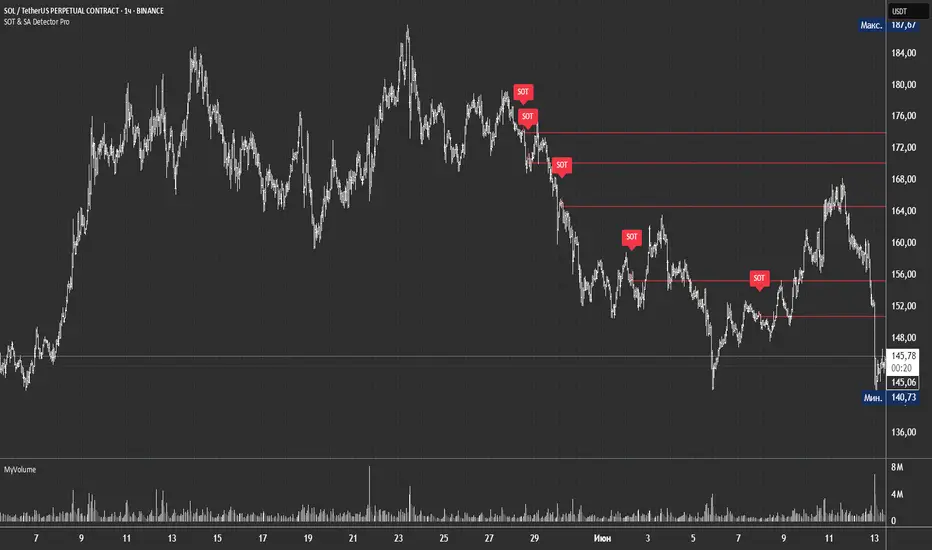
SOT & SA Detector ProSOT & SA Detector Pro- Advanced Reversal Pattern Recognition
OVERVIEW
The SOT & SA Detector is an educational indicator designed to identify potential market reversal points through systematic analysis of candlestick patterns, volume confirmation, and price wave structures. SOT (Shorting of Thrust) signals suggest potential bearish reversals after upward price movements, while SA (Selling Accumulation) signals indicate possible bullish reversals following downward trends. This tool helps traders recognize key market transition points by combining multiple technical criteria for enhanced signal reliability.
═══════════════════════════════════════════════════════════════
HOW IT WORKS
Technical Methodology
The indicator employs a multi-factor analysis approach that evaluates:
Wave Structure Analysis: Identifies minimum 2-bar directional waves (upward for SOT, downward for SA)
Price Delta Validation: Ensures closing price changes remain within specified percentage thresholds (default 0.3%) best 0.1.
Candlestick Tail Analysis: Measures rejection wicks using configurable tail multipliers
Volume Confirmation: Requires increased volume compared to previous periods
Pattern Confirmation: Validates signals through subsequent price action
Signal Generation Process
Pattern Recognition: Scans for qualifying candlestick formations with appropriate tail characteristics
Volume Verification: Confirms patterns with volume expansion using adjustable multiplier
Price Confirmation: Validates signals when price breaks and closes beyond pattern extremes
Signal Display: Places labeled markers and draws horizontal reference levels
Mathematical Foundation
Delta calculation: math.abs(close - close ) / close <= deltaPercent / 100
Tail analysis: (high - close ) >= tailMultiplier * (close - low ) for SOT
Volume filter: volume >= volume * volumeFactor
═══════════════════════════════════════════════════════════════
KEY FEATURES
Dual Pattern Recognition: Identifies both bullish (SA) and bearish (SOT) reversal candidates
Volume Integration: Incorporates volume analysis for enhanced signal validation
Customizable Parameters: Adjustable wave length, delta percentage, tail multiplier, and volume factor
Visual Clarity: Color-coded bar highlighting, labeled signals, and horizontal reference levels
Time-Based Filtering: Configurable analysis period to focus on recent market activity
Non-Repainting Signals: Confirmed signals remain stable and do not change with new price data
Alert System: Built-in notifications for both initial signals and subsequent confirmations
═══════════════════════════════════════════════════════════════
HOW TO USE
Signal Interpretation
Red SOT Labels: Appear above potential bearish reversal candles with downward-pointing markers
Green SA Labels: Display below potential bullish reversal candles with upward-pointing markers
Horizontal Lines: Extend from signal levels to provide ongoing reference points
Bar Coloring: Highlights qualifying pattern candles for visual emphasis
Trading Application
This indicator serves as an educational tool for pattern recognition and should be used in conjunction with additional analysis methods. Consider SOT signals as potential areas of selling pressure following upward moves, while SA signals may indicate buying interest after downward price action.
Best Practices
Combine with trend analysis and support/resistance levels
Consider overall market context and timeframe alignment
Use proper risk management techniques
Validate signals with additional technical indicators
═══════════════════════════════════════════════════════════════
SETTINGS
Analysis Days (Default: 20)
Controls the lookback period for signal detection. Higher values extend historical analysis while lower values focus on recent activity.
Minimum Bars in Wave (Default: 2)
Sets the minimum consecutive bars required to establish directional wave patterns. Increase for stronger trend confirmation.
Max Close Change % (Default: 0.3) best 0.1.
Defines acceptable closing price variation between consecutive bars. Lower values require tighter price consolidation.
Tail Multiplier (Default: 1.0) best 1.5 or more.
Adjusts sensitivity for candlestick tail analysis. Higher values require more pronounced rejection wicks.
Volume Factor (Default: 1.0)
Sets volume expansion threshold compared to previous period. Values above 1.0 require volume increases.
═══════════════════════════════════════════════════════════════
LIMITATIONS
Market Conditions
May produce false signals in highly volatile or low-volume conditions
Effectiveness varies across different market environments and timeframes
Requires sufficient volume data for optimal performance
Signal Timing
Signals appear after pattern completion, not in real-time during formation
Confirmation signals depend on subsequent price action
Historical signals do not guarantee future market behavior
Technical Constraints
Limited to analyzing price and volume data only
Does not incorporate fundamental analysis or external market factors
Performance may vary significantly across different trading instruments
═══════════════════════════════════════════════════════════════
IMPORTANT DISCLAIMERS
This indicator is designed for educational purposes and technical analysis learning. It does not constitute financial advice, investment recommendations, or trading signals. Past performance does not guarantee future results. Trading involves substantial risk of loss, and this tool should be used alongside proper risk management techniques and additional analysis methods.
Always conduct thorough analysis using multiple indicators and consider market context before making trading decisions. The SOT & SA patterns represent potential reversal points but do not guarantee price direction changes.
═══════════════════════════════════════════════════════════════
Credits: Original concept and Pine Script implementation by Everyday_Trader_X
Version: Pine Script v6 compatible
Category: Technical Analysis / Reversal Detection
Overlay: Yes (displays on price chart)
Aesthetic RSI [AlchimistOfCrypto]🌌 Aesthetic RSI – Unveiling the Fractal Forces of Markets 🌌
Category: Momentum Indicators 📈
"The RSI oscillator, formalized through an advanced mathematical prism, reveals the underlying fractal structures of price movements. This indicator draws inspiration from quantum principles of divergence-convergence where the probability of a return to equilibrium increases proportionally to the distance from the median point. Our implementation employs sophisticated algorithmic smoothing to filter out the stochastic noise inherent in financial markets, allowing visualization of the true momentum forces according to thermodynamic entropy principles applied to trading systems."
📊 Professional Trading Application
The Aesthetic RSI is a visually stunning and mathematically refined take on the classic Relative Strength Index. With customizable settings, advanced smoothing, and eight unique visual palettes, it empowers traders to detect momentum shifts and divergences with unparalleled clarity.
⚙️ Indicator Configuration
- Length 📏
The core parameter (default: 20) that determines the calculation period.
- Lower values (8-14): Increase sensitivity for short-term trading.
- Higher values (21-34): Provide stronger signals for position trading.
- OverBought/OverSold Thresholds 🎯
Customizable boundaries (default: 75/25) to identify extreme market conditions.
- Calibrate based on asset volatility: Higher volatility assets may need wider thresholds (80/20) to reduce false signals.
- Style 🎨
Eight meticulously crafted visual palettes optimized for pattern recognition:
- Miami Vice (default): High-contrast cyan/magenta scheme for spotting divergences.
- Cyberpunk: Yellow/purple combo to highlight momentum shifts.
- Classic: Traditional green/red for conventional analysis.
- High Contrast: Maximum visual separation for traders with visual impairments.
- Specialized palettes (Forest, Ocean, Fire, Monochrome): Tailored for diverse market conditions.
- Mode Selection 🔄
- Full: Displays a complete gradient spectrum across the RSI range, emphasizing momentum transitions between 35-65.
- OverZone: Focuses on actionable extreme zones, reducing noise in ranging markets.
🚀 How to Use
1. Adjust Length ⏰: Set the period based on your trading style (short-term or long-term).
2. Fine-Tune Thresholds 🎚️: Customize overbought/oversold levels to match the asset’s volatility.
3. Select a Palette 🌈: Choose a visual style that enhances your pattern recognition.
4. Choose Mode 🔍: Use "Full" for detailed momentum analysis or "OverZone" for extreme zone focus.
5. Spot Divergences ✅: Look for price-RSI divergences to anticipate reversals.
6. Trade with Precision 🛡️: Combine with other indicators for high-probability setups.
📅 Release Notes (April 2025)
Aesthetic RSI blends quantum-inspired mathematics with artistic visualization, redefining momentum analysis. Stay tuned for future enhancements! ✨
🏷️ Tags
#Trading #TechnicalAnalysis #RSI #Momentum #Divergence #MultiTimeframe #TradingStrategy #RiskManagement #Forex #Stocks #Crypto #Bitcoin #AlgoTrading #DayTrading #SwingTrading #TheAlchimist #QuantumTrading #VisualTrading #PatternRecognition
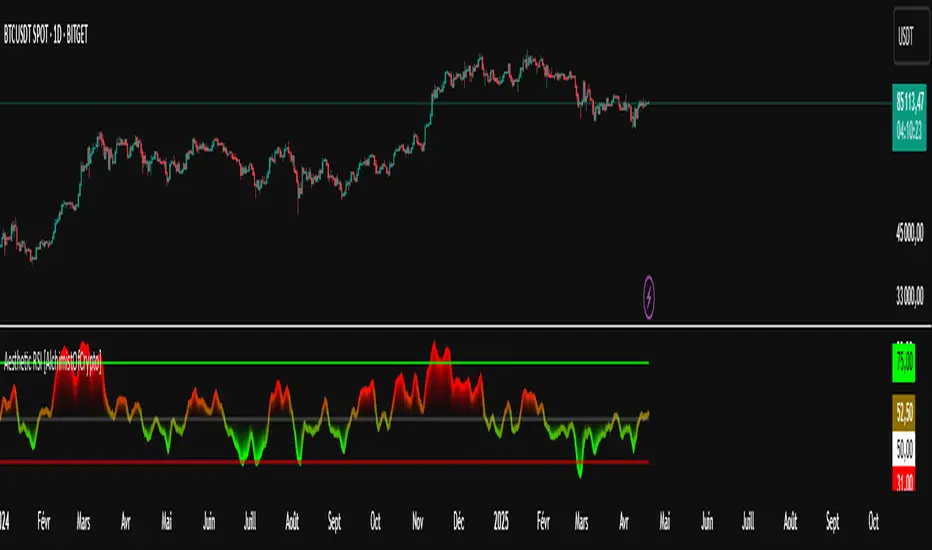
Daily COC Strategy with SHERLOCK WAVESThis indicator implements a unique trading strategy known as the "Daily COC (Candle Over Candle) Strategy" enhanced with "SHERLOCK WAVES" for pattern recognition. It's designed for traders looking to capitalize on specific candlestick formations with a negative risk-reward ratio, with the aim of achieving a high win rate (over 70%) through numerous trading opportunities, despite each trade having a higher risk relative to the reward.
Key Features:
Pattern Recognition: Identifies a setup based on three consecutive candles - a red candle followed by a shooting star, then an entry candle that does not break below the shooting star's low.
Negative Risk/Reward Trade Selection: Focuses on entries where the potential stop loss is greater than the take profit, banking on a high win rate to offset the individual trade's negative risk-reward ratio.
Visual Signals:
Green Label: Marks potential entry points at the high of the candle before the entry.
Green Dot: Indicates a winning trade closure.
Red Dot: Signals a losing trade closure.
Blue Circle: Warns when the current candle is within 2% of breaking above the previous candle's high, suggesting a potential setup is developing.
Green Circle: Plots the take profit level.
Red Circle: Plots the stop loss level.
Dynamic Statistics: A live updating label showing the number of trades, wins, losses, open trades, current account balance, and win percentage.
Customizable Parameters:
Risk % per Trade: Adjust the percentage of your account balance you're willing to risk on each trade.
Initial Account Balance: Set your starting balance for tracking performance.
Start Date for Strategy: Define when the strategy should start calculating from, allowing for backtesting.
Alerts:
An alert condition is set for when a potential trade setup is developing, helping traders prepare for entries.
Usage Tips:
This strategy is predicated on the idea that a high win rate can compensate for the negative risk-reward ratio of individual trades. It might not suit all market conditions or traders' risk profiles.
Use this strategy in conjunction with other analysis methods to validate trade setups.
Note: Always backtest thoroughly before applying to live markets. Consider this tool as part of a broader trading strategy, not a standalone solution. Monitor your win rate and adjust your risk management accordingly to ensure the strategy remains profitable over time.
This description now correctly explains the purpose behind the negative risk-reward ratio in the context of your trading strategy.

VMDM - Volume, Momentum & Divergence Master [BullByte]VMDM - Volume, Momentum and Divergence Master
Educational Multi-Layer Market Structure Analysis System
Multi-factor divergence engine that scores RSI momentum, volume pressure, and institutional footprints into one non-repainting confluence rating (0-100).
WHAT THIS INDICATOR IS
VMDM is an educational indicator designed to teach traders how to recognize high-probability reversal and continuation patterns by analyzing four independent market dimensions simultaneously. Instead of relying on a single indicator that may produce frequent false signals, VMDM creates a confluence-based scoring system that weights multiple confirmation factors, helping you understand which setups have stronger technical backing and which are lower quality.
This is NOT a trading system or signal generator. It is a learning tool that visualizes complex market structure concepts in an accessible format for both coders and non-coders.
THE PROBLEM IT SOLVES
Most traders face these common challenges:
Challenge 1 - Indicator Overload: Running RSI, volume analysis, and divergence detection separately creates chart clutter and conflicting signals. You waste time cross-referencing multiple windows trying to determine if all factors align.
Challenge 2 - False Divergences: Standard divergence indicators trigger on every minor pivot, creating noise. Many divergences fail because they lack supporting evidence from volume or market structure.
Challenge 3 - Missed Context: A bullish RSI divergence means nothing if it occurs during weak volume or in the middle of strong distribution. Context determines quality.
Challenge 4 - Repainting Confusion: Many divergence scripts repaint, showing perfect historical signals that never actually triggered in real-time, leading to false confidence.
Challenge 5 - Institutional Pattern Recognition: Absorption zones, stop hunts, and exhaustion patterns are taught in trading education but difficult to identify systematically without manual analysis.
VMDM addresses all five challenges by combining complementary analytical layers into one transparent, non-repainting, confluence-weighted system with visual clarity.
WHY THIS SPECIFIC COMBINATION - MASHUP JUSTIFICATION
This indicator is NOT a random mashup of popular indicators. Each of the four layers serves a specific analytical purpose and together they create a complete market structure assessment framework.
THE FOUR ANALYTICAL LAYERS
LAYER 1 - RSI MOMENTUM DIVERGENCE (Trend Exhaustion Detection)
Purpose: Identifies when price momentum is weakening before price itself reverses.
Why RSI: The Relative Strength Index measures momentum on a bounded 0-100 scale, making divergence detection mathematically consistent across all assets and timeframes. Unlike raw price oscillators, RSI normalizes momentum regardless of volatility regime.
How It Contributes: Divergence between price pivots and RSI pivots reveals early momentum exhaustion. A lower price low with a higher RSI low (bullish regular divergence) signals sellers are losing strength even as price makes new lows. This is the PRIMARY signal generator in VMDM.
Limitation If Used Alone: RSI divergence by itself produces many false signals because momentum can remain weak during continued trends. It needs confirmation from volume and structural evidence.
LAYER 2 - VOLUME PRESSURE ANALYSIS (Buying vs Selling Intensity)
Purpose: Quantifies whether the current bar's volume reflects buying pressure or selling pressure based on where price closed within the bar's range.
Methodology: Instead of just measuring volume size, VMDM calculates WHERE in the bar range the close occurred. A close near the high on high volume indicates strong buying absorption. A close near the low indicates selling pressure. The calculation accounts for wick size (wicks reduce pressure quality) and uses percentile ranking over a lookback period to normalize pressure strength on a 0-100 scale.
Formula Concept:
Buy Pressure = Volume × (Close - Low) / (High - Low) × Wick Quality Factor
Sell Pressure = Volume × (High - Close) / (High - Low) × Wick Quality Factor
Net Pressure = Buy Pressure - Sell Pressure
Pressure Strength = Percentile Rank of Net Pressure over lookback period
Why Percentile Ranking: Absolute volume varies by asset and session. Percentile ranking makes 85th percentile pressure on low-volume crypto comparable to 85th percentile pressure on high-volume forex.
How It Contributes: When a bullish divergence occurs at a pivot low AND pressure strength is above 60 (strong buying), this adds 25 confluence points. It confirms that the divergence is occurring during actual accumulation, not just weak selling.
Limitation If Used Alone: Pressure analysis shows current bar intensity but cannot identify trend exhaustion or reversal timing. High buying pressure can exist during a strong uptrend with no reversal imminent.
LAYER 3 - BEHAVIORAL FOOTPRINT PATTERNS (Volume Anomaly Detection)
CRITICAL DISCLAIMER: The terms "institutional footprint," "absorption," "stop hunt," and "exhaustion" used in this indicator are EDUCATIONAL LABELS for specific price and volume behavioral patterns. These patterns are detected through technical analysis of publicly available price, volume, and bar structure data. This indicator does NOT have access to actual institutional order flow, market maker data, broker stop-loss locations, or any non-public data source. These pattern names are used because they are common terminology in trading education to describe these technical behaviors. The analysis is interpretive and based on observable price action, not privileged information.
Purpose: Detect volume anomalies and price patterns that historically correlate with potential reversal zones or trend continuation failure.
Pattern Type 1 - Absorption (Labeled as "ACCUMULATION" or "DISTRIBUTION")
Detection Criteria: Volume is more than 2x the moving average AND bar range is less than 50 percent of the average bar range.
Interpretation: High volume compressed into a tight range suggests large participants are absorbing supply (accumulation) or distribution (distribution) without allowing price to move significantly. This often precedes directional moves once absorption completes.
Visual: Colored box zone highlighting the absorption area.
Pattern Type 2 - Stop Hunt (Labeled as "BULL HUNT" or "BEAR HUNT")
Detection Criteria: Price penetrates a recent 10-bar high or low by a small margin (0.2 percent), then closes back inside the range on above-average volume (1.5x+).
Interpretation: Price briefly spikes beyond recent structure (likely triggering stop losses placed just beyond obvious levels) then reverses. This is a classic false breakout pattern often seen before reversals.
Visual: Label at the wick extreme showing hunt direction.
Pattern Type 3 - Exhaustion (Labeled as "SELL EXHAUST" or "BUY EXHAUST")
Detection Criteria: Lower wick is more than 2.5x the body size with volume above 1.8x average and RSI below 35 (sell exhaustion), OR upper wick more than 2.5x body size with volume above 1.8x average and RSI above 65 (buy exhaustion).
Interpretation: Large wicks with high volume and extreme RSI suggest aggressive buying or selling was met with equally aggressive rejection. This exhaustion often marks short-term extremes.
Visual: Label showing exhaustion type.
How These Contribute: When a divergence forms at a pivot AND one of these behavioral patterns is active, the confluence score increases by 20 points. This confirms the divergence is occurring during structural anomaly activity, not just normal price flow.
Limitation If Used Alone: These patterns can occur mid-trend and do not indicate direction without momentum context. Absorption in a strong uptrend may just be continuation accumulation.
LAYER 4 - CONFLUENCE SCORING MATRIX (Quality Weighting System)
Purpose: Translate all detected conditions into a single 0-100 quality score so you can objectively compare setups.
Scoring Breakdown:
Divergence Present: +30 points (primary signal)
Pressure Confirmation: +25 points (volume supports direction)
Behavioral Footprint Active: +20 points (structural anomaly present)
RSI Extreme: +15 points (RSI below 30 or above 70 at pivot)
Volume Spike: +10 points (current volume above 1.5x average)
Maximum Possible Score: 100 points
Why These Weights: The weights reflect reliability hierarchy based on backtesting observation. Divergence is the core signal (30 points), but without volume confirmation (25 points) many fail. Behavioral patterns add meaningful context (20 points). RSI extremes and volume spikes are secondary confirmations (15 and 10 points).
Quality Tiers:
90-100: TEXTBOOK (all factors aligned)
75-89: HIGH QUALITY (strong confluence)
60-74: VALID (meets minimum threshold)
Below 60: DEVELOPING (not displayed unless threshold lowered)
How It Contributes: The confluence score allows you to filter noise. You can set your minimum quality threshold in settings. Higher thresholds (75+) show fewer but higher-quality patterns. Lower thresholds (50-60) show more patterns but include lower-confidence setups. This teaches you to distinguish strong setups from weak ones.
Limitation: Confluence scoring is historical observation-based, not predictive guarantee. A 95-point setup can still fail. The score represents technical alignment, not future certainty.
WHY THIS COMBINATION WORKS TOGETHER
Each layer addresses a limitation in the others:
RSI Divergence identifies WHEN momentum is exhausting (timing)
Volume Pressure confirms WHETHER the exhaustion is accompanied by opposite-side accumulation (confirmation)
Behavioral Footprint shows IF structural anomalies support the reversal hypothesis (context)
Confluence Scoring weights ALL factors into an objective quality metric (filtering)
Using only RSI divergence gives you timing without confirmation. Using only volume pressure gives you intensity without directional context. Using only pattern detection gives you anomalies without trend exhaustion context. Using all four together creates a complete analytical framework where each layer compensates for the others' weaknesses.
This is not a mashup for the sake of combining indicators. It is a structured analytical system where each component has a defined role in a multi-dimensional market assessment process.
HOW TO READ THE INDICATOR - VISUAL ELEMENTS GUIDE
VMDM displays up to five visual layer types. You can enable or disable each layer independently in settings under "Visual Layers."
VISUAL LAYER 1 - MARKET STRUCTURE (Pivot Points and Lines)
What You See:
Small labels at swing highs and lows marked "PH" (Pivot High) and "PL" (Pivot Low) with horizontal dashed lines extending right from each pivot.
What It Means:
These are CONFIRMED pivots, not real-time. A pivot low appears AFTER the required right-side confirmation bars pass (default 3 bars). This creates a delay but prevents repainting. The pivot only appears once it is mathematically confirmed.
The horizontal lines represent support (from pivot lows) and resistance (from pivot highs) levels where price previously found significant rejection.
Color Coding:
Green label and line: Pivot Low (potential support)
Red label and line: Pivot High (potential resistance)
How To Use:
These pivots are the foundation for divergence detection. Divergence is only calculated between confirmed pivots, ensuring all signals are non-repainting. The lines help you see historical structure levels.
VISUAL LAYER 2 - PRESSURE ZONES (Background Color)
What You See:
Subtle background color shading on bars - light green or light red tint.
What It Means:
This visualizes volume pressure strength in real-time.
Color Coding:
Light Green Background: Pressure Strength above 70 (strong buying pressure - price closing near highs on volume)
Light Red Background: Pressure Strength below 30 (strong selling pressure - price closing near lows on volume)
No Color: Neutral pressure (pressure between 30-70)
How To Use:
When a bullish divergence pattern appears during green pressure zones, it suggests the divergence is forming during accumulation. When a bearish divergence appears during red zones, distribution is occurring. Pressure zones help you filter divergences - those forming in supportive pressure environments have higher probability.
VISUAL LAYER 3 - DIVERGENCE LINES (Dotted Connectors)
What You See:
Dotted lines connecting two pivot points (either two pivot lows or two pivot highs).
What It Means:
A divergence has been detected between those two pivots. The line connects the price pivots where RSI showed opposite behavior.
Color Coding:
Bright Green Line: Bullish divergence (regular or hidden)
Bright Red Line: Bearish divergence (regular or hidden)
How To Use:
The divergence line appears ONLY after the second pivot is confirmed (delayed by right-side confirmation bars). This is intentional to prevent repainting. When you see the line appear, it means:
For Bullish Regular Divergence:
Price made a lower low (second pivot lower than first)
RSI made a higher low (RSI at second pivot higher than first)
Interpretation: Downtrend losing momentum
For Bullish Hidden Divergence:
Price made a higher low (second pivot higher than first)
RSI made a lower low (RSI at second pivot lower than first)
Interpretation: Uptrend continuation likely (pullback within uptrend)
For Bearish Regular Divergence:
Price made a higher high (second pivot higher than first)
RSI made a lower high (RSI at second pivot lower than first)
Interpretation: Uptrend losing momentum
For Bearish Hidden Divergence:
Price made a lower high (second pivot lower than first)
RSI made a higher high (RSI at second pivot higher than first)
Interpretation: Downtrend continuation likely (bounce within downtrend)
If "Show Consolidated Analysis Label" is disabled, a small label will appear on the divergence line showing the divergence type abbreviation.
VISUAL LAYER 4 - BEHAVIORAL FOOTPRINT MARKERS
What You See:
Boxes, labels, and markers at specific bars showing pattern detection.
ABSORPTION ZONES (Boxes):
Colored rectangular boxes spanning one or more bars.
Purple Box: Accumulation absorption zone (high volume, tight range, bullish close)
Red Box: Distribution absorption zone (high volume, tight range, bearish close)
If absorption continues for multiple consecutive bars, the box extends and a counter appears in the label showing how many bars the absorption lasted.
What It Means: Large volume is being absorbed without significant price movement. This often precedes directional breakouts once the absorption phase completes.
STOP HUNT MARKERS (Labels):
Small labels below or above wicks labeled "BULL HUNT" or "BEAR HUNT" (may show bar count if consecutive).
What It Means:
BULL HUNT : Price spiked below recent lows then reversed back up on volume - likely triggered sell stops before reversing
BEAR HUNT : Price spiked above recent highs then reversed back down on volume - likely triggered buy stops before reversing
EXHAUSTION MARKERS (Labels):
Labels showing "SELL EXHAUST" or "BUY EXHAUST."
What It Means:
SELL EXHAUST : Large lower wick with high volume and low RSI - aggressive selling met with strong rejection
BUY EXHAUST : Large upper wick with high volume and high RSI - aggressive buying met with strong rejection
How To Use:
These markers help you identify WHERE structural anomalies occurred. When a divergence signal appears AT THE SAME TIME as one of these patterns, the confluence score increases. You are looking for alignment - divergence + behavioral pattern + pressure confirmation = high-quality setup.
VISUAL LAYER 5 - CONSOLIDATED ANALYSIS LABEL (Main Pattern Signal)
What You See:
A large label appearing at pivot points (or in real-time mode, at current bar) containing full pattern analysis.
Label Appearance:
Depending on your "Use Compact Label Format" setting:
COMPACT MODE (Single Line):
Example: "BULLISH REGULAR | Q:HIGH QUALITY C:82"
Breakdown:
BULLISH REGULAR: Divergence type detected
Q:HIGH QUALITY: Pattern quality tier
C:82: Confluence score (82 out of 100)
FULL MODE (Multi-Line Detailed):
Example:
PATTERN DETECTED
-------------------
BULLISH REGULAR
Quality: HIGH QUALITY
Price: Lower Low
Momentum: Higher Low
Signal: Weakening Downtrend
CONFLUENCE: 82/100
-------------------
Divergence: 30
Pressure: 25
Institutional: 20
RSI Extreme: 0
Volume: 10
Breakdown:
Top section: Pattern type and quality
Middle section: Divergence explanation (what price did vs what RSI did)
Bottom section: Confluence score with itemized breakdown showing which factors contributed
Label Position:
In Confirmed modes: Label appears AT the pivot point (delayed by confirmation bars)
In Real-time mode: Label appears at current bar as conditions develop
Label Color:
Gold: Textbook quality (90+ confluence)
Green: High quality (75-89 confluence)
Blue: Valid quality (60-74 confluence)
How To Use:
This is your primary decision-making label. When it appears:
Check the divergence type (regular divergences are reversal signals, hidden divergences are continuation signals)
Review the quality tier (textbook and high quality have better historical win rates)
Examine the confluence breakdown to see which factors are present and which are missing
Look at the chart context (trend, support/resistance, timeframe)
Use this information to assess whether the setup aligns with your strategy
The label does NOT tell you to buy or sell. It tells you a technical pattern has formed and provides the quality assessment. Your trading decision must incorporate risk management, market context, and your strategy rules.
UNDERSTANDING THE THREE DETECTION MODES
VMDM offers three signal detection modes in settings to accommodate different trading styles and learning objectives.
MODE 1: "Confluence Only (Real-Time)"
How It Works: Displays signals AS THEY DEVELOP on the current bar without waiting for pivot confirmation. The system calculates confluence score from pressure, volume, RSI extremes, and behavioral patterns. Divergence signals are NOT required in this mode.
Delay: ZERO - signals appear immediately.
Use Case: Real-time scanning for high-confluence zones without divergence requirement. Useful for intraday traders who want immediate alerts when multiple factors align.
Tradeoff: More frequent signals but includes setups without confirmed divergence. Higher false signal rate. Signals can change as the bar develops (not repainting in historical bars, but current bar updates).
Visual Behavior: Labels appear at the current bar. No divergence lines unless divergence happens to be present.
MODE 2: "Divergence + Confluence (Confirmed)" - DEFAULT RECOMMENDED
How It Works: Full system engagement. Signals appear ONLY when:
A pivot is confirmed (requires right-side confirmation bars to pass)
Divergence is detected between current pivot and previous pivot
Total confluence score meets or exceeds your minimum threshold
Delay: Equal to your "Pivot Right Bars" setting (default 3 bars). This means signals appear 3 bars AFTER the actual pivot formed.
Use Case: Highest-quality, non-repainting signals for swing traders and learners who want to study confirmed pattern completion.
Tradeoff: Delayed signals. You will not receive the signal until confirmation occurs. In fast-moving markets, price may have already moved significantly by the time the signal appears.
Visual Behavior: Labels appear at the historical pivot location (in the past). Divergence lines connect the two pivots. This is the most educational mode because it shows completed, confirmed patterns.
Non-Repainting Guarantee: Yes. Once a signal appears, it never disappears or changes.
MODE 3: "Divergence + Confluence (Relaxed)"
How It Works: Same as Confirmed mode but with adaptive thresholds. If confluence is very high (10 points above threshold), the signal may appear even if some factors are weak. If divergence is present but confluence is slightly below threshold (within 10 points), it may still appear.
Delay: Same as Confirmed mode (right-side confirmation bars).
Use Case: Slightly more signals than Confirmed mode for traders willing to accept near-threshold setups.
Tradeoff: More signals but lower average quality than Confirmed mode.
Visual Behavior: Same as Confirmed mode.
DASHBOARD GUIDE - READING THE METRICS
The dashboard appears in the corner of your chart (position selectable in settings) and provides real-time market state analysis.
You can choose between four dashboard detail levels in settings: Off, Compact, Optimized (default), Full.
DASHBOARD ROW EXPLANATIONS
ROW 1 - Header Information
Left: Current symbol and timeframe
Center: "VMDM "
Right: Version number
ROW 2 - Mode and Delay
Shows which detection mode you are using and the signal delay.
Example: "CONFIRMED | Delay: 3 bars"
This reminds you that signals in confirmed mode appear 3 bars after the pivot forms.
ROW 3 - Market Regime
Format: "TREND UP HV" or "RANGING NV"
First Part - Trend State:
TREND UP: 20 EMA above 50 EMA with strong separation
TREND DOWN: 20 EMA below 50 EMA with strong separation
RANGING: EMAs close together, low trend strength
TRANSITION: Between trending and ranging states
Second Part - Volatility State:
HV: High Volatility (current ATR more than 1.3x the 50-bar average ATR)
NV: Normal Volatility (current ATR between 0.7x and 1.3x average)
LV: Low Volatility (current ATR less than 0.7x average)
Third Column: Volatility ratio (example: "1.45x" means current ATR is 1.45 times normal)
How To Use: Regime context helps you interpret signals. Reversal divergences are more reliable in ranging or transitional regimes. Continuation divergences (hidden) are more reliable in trending regimes. High volatility means wider stops may be needed.
ROW 4 - Pressure
Shows current volume pressure state.
Format: "BUYING | ██████████░░░░░░░░░"
States:
BUYING : Pressure strength above 60 (closes near highs)
SELLING : Pressure strength below 40 (closes near lows)
NEUTRAL : Pressure strength between 40-60
Bar Visualization: Each block represents 10 percentile points. A full bar (10 filled blocks) = 100th percentile pressure.
Color: Green for buying, red for selling, gray for neutral.
How To Use: When pressure aligns with divergence direction (bullish divergence during buying pressure), confluence is stronger.
ROW 5 - Volume and RSI
Format: "1.8x | RSI 68 | OB"
First Value: Current volume ratio (1.8x = volume is 1.8 times the moving average)
Second Value: Current RSI reading
Third Value: RSI state
OB: Overbought (RSI above 70)
OS: Oversold (RSI below 30)
Blank: Neutral RSI
How To Use: Volume spikes (above 1.5x) during divergence formation add confluence. RSI extremes at pivots add confluence.
ROW 6 - Behavioral Footprint
Format: "BULL HUNT | 2 bars"
Shows the most recent behavioral pattern detected and how long ago.
States:
ACCUMULATION / DISTRIBUTION: Absorption detected
BULL HUNT / BEAR HUNT: Stop hunt detected
SELL EXHAUST / BUY EXHAUST: Exhaustion detected
SCANNING: No recent pattern
NOW: Pattern is active on current bar
How To Use: When footprint activity is recent (within 50 bars) or active now, it adds context to divergence signals forming in that area.
ROW 7 - Current Pattern
Shows the divergence type currently detected (if any).
Examples: "BULLISH REGULAR", "BEARISH HIDDEN", "Scanning..."
Quality: Shows pattern quality (TEXTBOOK, HIGH QUALITY, VALID)
How To Use: This tells you what type of signal is active. Regular divergences are reversal setups. Hidden divergences are continuation setups.
ROW 8 - Session Summary
Format: "14 events | A3 H8 E3"
First Value: Total institutional events this session
Breakdown:
A: Absorption events
H: Stop hunt events
E: Exhaustion events
How To Use: High event counts suggest an active, volatile session with frequent structural anomalies. Low counts suggest quiet, orderly price action.
ROW 9 - Confluence Score (Optimized/Full mode only)
Format: "78/100 | ████████░░"
Shows current real-time confluence score even if no pattern is confirmed yet.
How To Use: Watch this in real-time to see how close you are to pattern formation. When it exceeds your threshold and divergence forms, a signal will appear (after confirmation delay).
ROW 10 - Patterns Studied (Optimized/Full mode only)
Format: "47 patterns | 12 bars ago"
First Value: Total confirmed patterns detected since chart loaded
Second Value: How many bars since the last confirmed pattern appeared
How To Use: Helps you understand pattern frequency on your selected symbol and timeframe. If many bars have passed since last pattern, market may be trending without reversal opportunities.
ROW 11 - Bull/Bear Ratio (Optimized/Full mode only)
Format: "28:19 | BULL"
Shows count of bullish vs bearish patterns detected.
Balance:
BULL: More bullish patterns detected (suggests market has had more bullish reversals/continuations)
BEAR: More bearish patterns detected
BAL: Equal counts
How To Use: Extreme imbalances can indicate directional bias in the studied period. A heavily bullish ratio in a downtrend might suggest frequent failed rallies (bearish continuation). Context matters.
ROW 12 - Volume Ratio Detail (Optimized/Full mode only)
Shows current volume vs average volume in absolute terms.
Example: "1.4x | 45230 / 32300"
How To Use: Confirms whether current activity is above or below normal.
ROW 13 - Last Institutional Event (Full mode only)
Shows the most recent institutional pattern type and how many bars ago it occurred.
Example: "DISTRIBUTION | 23 bars"
How To Use: Tracks recency of last anomaly for context.
SETTINGS GUIDE - EVERY PARAMETER EXPLAINED
PERFORMANCE SECTION
Enable All Visuals (Master Toggle)
Default: ON
What It Does: Master kill switch for ALL visual elements (labels, lines, boxes, background colors, dashboard). When OFF, only plot outputs remain (invisible unless you open data window).
When To Change: Turn OFF on mobile devices, 1-second charts, or slow computers to improve performance. You can still receive alerts even with visuals disabled.
Impact: Dramatic performance improvement when OFF, but you lose all visual feedback.
Maximum Object History
Default: 50 | Range: 10-100
What It Does: Limits how many of each object type (labels, lines, boxes) are kept in memory. Older objects beyond this limit are deleted.
When To Change: Lower to 20-30 on fast timeframes (1-minute charts) to prevent slowdown. Increase to 100 on daily charts if you want more historical pattern visibility.
Impact: Lower values = better performance but less historical visibility. Higher values = more history visible but potential slowdown on fast timeframes.
Alert Cooldown (Bars)
Default: 5 | Range: 1-50
What It Does: Minimum number of bars that must pass before another alert of the same type can fire. Prevents alert spam when multiple patterns form in quick succession.
When To Change: Increase to 20+ on 1-minute charts to reduce noise. Decrease to 1-2 on daily charts if you want every pattern alerted.
Impact: Higher cooldown = fewer alerts. Lower cooldown = more alerts.
USER EXPERIENCE SECTION
Show Enhanced Tooltips
Default: ON
What It Does: Enables detailed hover-over tooltips on labels and visual elements.
When To Change: Turn OFF if you encounter Pine Script compilation errors related to tooltip arguments (rare, platform-specific issue).
Impact: Minimal. Just adds helpful hover text.
MARKET STRUCTURE DETECTION SECTION
Pivot Left Bars
Default: 3 | Range: 2-10
What It Does: Number of bars to the LEFT of the center bar that must be higher (for pivot low) or lower (for pivot high) than the center bar for a pivot to be valid.
Example: With value 3, a pivot low requires the center bar's low to be lower than the 3 bars to its left.
When To Change:
Increase to 5-7 on noisy timeframes (1-minute charts) to filter insignificant pivots
Decrease to 2 on slow timeframes (daily charts) to catch more pivots
Impact: Higher values = fewer, more significant pivots = fewer signals. Lower values = more frequent pivots = more signals but more noise.
Pivot Right Bars
Default: 3 | Range: 2-10
What It Does: Number of bars to the RIGHT of the center bar that must pass for confirmation. This creates the non-repainting delay.
Example: With value 3, a pivot is confirmed 3 bars AFTER it forms.
When To Change:
Increase to 5-7 for slower, more confirmed signals (better for swing trading)
Decrease to 2 for faster signals (better for intraday, but still non-repainting)
Impact: Higher values = longer delay but more reliable confirmation. Lower values = faster signals but less confirmation. This setting directly controls your signal delay in Confirmed and Relaxed modes.
Minimum Confluence Score
Default: 60 | Range: 40-95
What It Does: The threshold score required for a pattern to be displayed. Patterns with confluence scores below this threshold are not shown.
When To Change:
Increase to 75+ if you only want high-quality textbook setups (fewer signals)
Decrease to 50-55 if you want to see more developing patterns (more signals, lower average quality)
Impact: This is your primary signal filter. Higher threshold = fewer, higher-quality signals. Lower threshold = more signals but includes weaker setups. Recommended starting point is 60-65.
TECHNICAL PERIODS SECTION
RSI Period
Default: 14 | Range: 5-50
What It Does: Lookback period for RSI calculation.
When To Change:
Decrease to 9-10 for faster, more sensitive RSI that detects shorter-term momentum changes
Increase to 21-28 for slower, smoother RSI that filters noise
Impact: Lower values make RSI more volatile (more frequent extremes and divergences). Higher values make RSI smoother (fewer but more significant divergences). 14 is industry standard.
Volume Moving Average Period
Default: 20 | Range: 10-200
What It Does: Lookback period for calculating average volume. Current volume is compared to this average to determine volume ratio.
When To Change:
Decrease to 10-14 for shorter-term volume comparison (more sensitive to recent volume changes)
Increase to 50-100 for longer-term volume comparison (smoother, less sensitive)
Impact: Lower values make volume ratio more volatile. Higher values make it more stable. 20 is standard.
ATR Period
Default: 14 | Range: 5-100
What It Does: Lookback period for Average True Range calculation used for volatility measurement and label positioning.
When To Change: Rarely needs adjustment. Use 7-10 for faster volatility response, 21-28 for slower.
Impact: Affects volatility ratio calculation and visual label spacing. Minimal impact on signals.
Pressure Percentile Lookback
Default: 50 | Range: 10-300
What It Does: Lookback period for calculating volume pressure percentile ranking. Your current pressure is ranked against the pressure of the last X bars.
When To Change:
Decrease to 20-30 for shorter-term pressure context (more responsive to recent changes)
Increase to 100-200 for longer-term pressure context (smoother rankings)
Impact: Lower values make pressure strength more sensitive to recent bars. Higher values provide more stable, long-term pressure assessment. Capped at 300 for performance reasons.
SIGNAL DETECTION SECTION
Signal Detection Mode
Default: "Divergence + Confluence (Confirmed)"
Options:
Confluence Only (Real-time)
Divergence + Confluence (Confirmed)
Divergence + Confluence (Relaxed)
What It Does: Selects which detection logic mode to use (see "Understanding The Three Detection Modes" section above).
When To Change: Use Confirmed for learning and non-repainting signals. Use Real-time for live scanning without divergence requirement. Use Relaxed for slightly more signals than Confirmed.
Impact: Fundamentally changes when and how signals appear.
VISUAL LAYERS SECTION
All toggles default to ON. Each controls visibility of one visual layer:
Show Market Structure: Pivot markers and support/resistance lines
Show Pressure Zones: Background color shading
Show Divergence Lines: Dotted lines connecting pivots
Show Institutional Footprint Markers: Absorption boxes, hunt labels, exhaustion labels
Show Consolidated Analysis Label: Main pattern detection label
Use Compact Label Format
Default: OFF
What It Does: Switches consolidated label between single-line compact format and multi-line detailed format.
When To Change: Turn ON if you find full labels too large or distracting.
Impact: Visual clarity vs. information density tradeoff.
DASHBOARD SECTION
Dashboard Mode
Default: "Optimized"
Options: Off, Compact, Optimized, Full
What It Does: Controls how much information the dashboard displays.
Off: No dashboard
Compact: 8 rows (essential metrics only)
Optimized: 12 rows (recommended balance)
Full: 13 rows (every available metric)
Dashboard Position
Default: "Top Right"
Options: Top Right, Top Left, Bottom Right, Bottom Left
What It Does: Screen corner where dashboard appears.
HOW TO USE VMDM - PRACTICAL WORKFLOW
STEP 1 - INITIAL SETUP
Add VMDM to your chart
Select your detection mode (Confirmed recommended for learning)
Set your minimum confluence score (start with 60-65)
Adjust pivot parameters if needed (default 3/3 is good for most timeframes)
Enable the visual layers you want to see
STEP 2 - CHART ANALYSIS
Let the indicator load and analyze historical data
Review the patterns that appear historically
Examine the confluence scores - notice which patterns had higher scores
Observe which patterns occurred during supportive pressure zones
Notice the divergence line connections - understand what price vs RSI did
STEP 3 - PATTERN RECOGNITION LEARNING
When a consolidated analysis label appears:
Read the divergence type (regular or hidden, bullish or bearish)
Check the quality tier (textbook, high quality, or valid)
Review the confluence breakdown - which factors contributed
Look at the chart context - where is price relative to structure, trend, etc.
Observe the behavioral footprint markers nearby - do they support the pattern
STEP 4 - REAL-TIME MONITORING
Watch the dashboard for real-time regime and pressure state
Monitor the current confluence score in the dashboard
When it approaches your threshold, be alert for potential pattern formation
When a new pattern appears (after confirmation delay), evaluate it using the workflow above
Use your trading strategy rules to decide if the setup aligns with your criteria
STEP 5 - POST-PATTERN OBSERVATION
After a pattern appears:
Mark the level on your chart
Observe what price does after the pattern completes
Did price respect the reversal/continuation signal
What was the confluence score of patterns that worked vs. those that failed
Learn which quality tiers and confluence levels produce better results on your specific symbol and timeframe
RECOMMENDED TIMEFRAMES AND ASSET CLASSES
VMDM is timeframe-agnostic and works on any asset with volume data. However, optimal performance varies:
BEST TIMEFRAMES
15-Minute to 1-Hour: Ideal balance of signal frequency and reliability. Pivot confirmation delay is acceptable. Sufficient volume data for pressure analysis.
4-Hour to Daily: Excellent for swing trading. Very high-quality signals. Lower frequency but higher significance. Recommended for learning because patterns are clearer.
1-Minute to 5-Minute: Works but requires adjustment. Increase pivot bars to 5-7 for filtering. Decrease max object history to 30 for performance. Expect more noise.
Weekly/Monthly: Works but very infrequent signals. Increase confluence threshold to 70+ to ensure only major patterns appear.
BEST ASSET CLASSES
Forex Majors: Excellent volume data and clear trends. Pressure analysis works well.
Crypto (Major Pairs): Good volume data. High volatility makes divergences more pronounced. Works very well.
Stock Indices (SPY, QQQ, etc.): Excellent. Clean price action and reliable volume.
Individual Stocks: Works well on high-volume stocks. Low-volume stocks may produce unreliable pressure readings.
Commodities (Gold, Oil, etc.): Works well. Clear trends and reactions.
WHAT THIS INDICATOR CANNOT DO - LIMITATIONS
LIMITATION 1 - It Does Not Predict The Future
VMDM identifies when technical conditions align historically associated with potential reversals or continuations. It does not predict what will happen next. A textbook 95-confluence pattern can still fail if fundamental events, news, or larger timeframe structure override the setup.
LIMITATION 2 - Confirmation Delay Means You Miss Early Entry
In Confirmed and Relaxed modes, the non-repainting design means you receive signals AFTER the pivot is confirmed. Price may have already moved significantly by the time you receive the signal. This is the tradeoff for non-repainting reliability. You can use Real-time mode for faster signals but sacrifice divergence confirmation.
LIMITATION 3 - It Does Not Tell You Position Sizing or Risk Management
VMDM provides technical pattern analysis. It does not calculate stop loss levels, take profit targets, or position sizing. You must apply your own risk management rules. Never risk more than you can afford to lose based on a technical signal.
LIMITATION 4 - Volume Pressure Analysis Requires Reliable Volume Data
On assets with thin volume or unreliable volume reporting, pressure analysis may be inaccurate. Stick to major liquid assets with consistent volume data.
LIMITATION 5 - It Cannot Detect Fundamental Events
VMDM is purely technical. It cannot predict earnings reports, central bank decisions, geopolitical events, or other fundamental catalysts that can override technical patterns.
LIMITATION 6 - Divergence Requires Two Pivots
The indicator cannot detect divergence until at least two pivots of the same type have formed. In strong trends without pullbacks, you may go long periods without signals.
LIMITATION 7 - Institutional Pattern Names Are Interpretive
The behavioral footprint patterns are named using common trading education terminology, but they are detected through technical analysis, not actual institutional data access. The patterns are interpretations based on price and volume behavior.
CONCEPT FOUNDATION - WHY THIS APPROACH WORKS
MARKET PRINCIPLE 1 - Momentum Divergence Precedes Price Reversal
Price is the final output of market forces, but momentum (the rate of change in those forces) shifts first. When price makes a new low but the momentum behind that move is weaker (higher RSI low), it signals that sellers are losing strength even though they temporarily pushed price lower. This precedes reversal. This is a fundamental principle in technical analysis taught by Charles Dow, widely observed in market behavior.
MARKET PRINCIPLE 2 - Volume Reveals Conviction
Price can move on low volume (low conviction) or high volume (high conviction). When price makes a new low on declining volume while RSI shows improving momentum, it suggests the new low is not confirmed by participant conviction. Adding volume pressure analysis to momentum divergence adds a confirmation layer that filters false divergences.
MARKET PRINCIPLE 3 - Anomalies Mark Structural Extremes
When volume spikes significantly but range contracts (absorption), or when price spikes beyond structure then reverses (stop hunt), or when aggressive moves are met with large-wick rejection (exhaustion), these anomalies often mark short-term extremes. Combining these structural observations with momentum analysis creates context.
MARKET PRINCIPLE 4 - Confluence Improves Probability
No single technical factor is reliable in isolation. RSI divergence alone fails frequently. Volume analysis alone cannot time entries. Combining multiple independent factors into a weighted system increases the probability that observed patterns have structural significance rather than random noise.
THE EDUCATIONAL VALUE
By visualizing all four layers simultaneously and breaking down the confluence scoring transparently, VMDM teaches you to think in terms of multi-dimensional analysis rather than single-indicator reliance. Over time, you will learn to recognize these patterns manually and understand which combinations produce better results on your traded assets.
INSTITUTIONAL TERMINOLOGY - IMPORTANT CLARIFICATION
This indicator uses the following terms that are common in trading education:
Institutional Footprint
Absorption (Accumulation / Distribution)
Stop Hunt
Exhaustion
CRITICAL DISCLAIMER:
These terms are EDUCATIONAL LABELS for specific price action and volume behavior patterns detected through technical analysis of publicly available chart data (open, high, low, close, volume). This indicator does NOT have access to:
Actual institutional order flow or order book data
Market maker positions or intentions
Broker stop-loss databases
Non-public trading data
Proprietary institutional information
The patterns labeled as "institutional footprint" are interpretations based on observable price and volume behavior that educational trading literature often associates with potential large-participant activity. The detection is algorithmic pattern recognition, not privileged data access.
When this indicator identifies "absorption," it means it detected high volume within a small range - a condition that MAY indicate large orders being filled but is not confirmation of actual institutional participation.
When it identifies a "stop hunt," it means price briefly penetrated a structural level then reversed - a pattern that MAY have triggered stop losses but is not confirmation that stops were specifically targeted.
When it identifies "exhaustion," it means high volume with large rejection wicks - a pattern that MAY indicate aggressive participation meeting strong opposition but is not confirmation of institutional involvement.
These are technical analysis interpretations, not factual statements about market participant identity or intent.
DISCLAIMER AND RISK WARNING
EDUCATIONAL PURPOSE ONLY
This indicator is designed as an educational tool to help traders learn to recognize technical patterns, understand multi-factor analysis, and practice systematic market observation. It is NOT a trading system, signal service, or financial advice.
NO PERFORMANCE GUARANTEE
Past pattern behavior does not guarantee future results. A pattern that historically preceded price movement in one direction may fail in the future due to changing market conditions, fundamental events, or random variance. Confluence scores reflect historical technical alignment, not future certainty.
TRADING INVOLVES SUBSTANTIAL RISK
Trading financial instruments involves substantial risk of loss. You can lose more than your initial investment. Never trade with money you cannot afford to lose. Always use proper risk management including stop losses, position sizing, and portfolio diversification.
NO PREDICTIVE CLAIMS
This indicator does NOT predict future price movement. It identifies when technical conditions align in patterns that historically have been associated with potential reversals or continuations. Market behavior is probabilistic, not deterministic.
BACKTESTING LIMITATIONS
If you backtest trading strategies using this indicator, ensure you account for:
Realistic commission costs
Realistic slippage (difference between signal price and actual fill price)
Sufficient sample size (minimum 100 trades for statistical relevance)
Reasonable position sizing (risking no more than 1-2 percent of account per trade)
The confirmation delay inherent in the indicator (you cannot enter at the exact pivot in Confirmed mode)
Backtests that do not account for these factors will produce unrealistic results.
AUTHOR LIABILITY
The author (BullByte) is not responsible for any trading losses incurred using this indicator. By using this indicator, you acknowledge that all trading decisions are your sole responsibility and that you understand the risks involved.
NOT FINANCIAL ADVICE
Nothing in this indicator, its code, its description, or its visual outputs constitutes financial, investment, or trading advice. Consult a licensed financial advisor before making investment decisions.
FREQUENTLY ASKED QUESTIONS
Q: Why do signals appear in the past, not at the current bar
A: In Confirmed and Relaxed modes, signals appear at confirmed pivots, which requires waiting for right-side confirmation bars (default 3). This creates a delay but prevents repainting. Use Real-time mode if you want current-bar signals without pivot confirmation.
Q: Can I use this for automated trading
A: You can create alert-based automation, but understand that Confirmed mode signals appear AFTER the pivot with delay, so your entry will not be at the pivot price. Real-time mode signals can change as the current bar develops. Automation requires careful consideration of these factors.
Q: How do I know which confluence score to use
A: Start with 60. Observe which patterns work on your symbol/timeframe. If too many false signals, increase to 70-75. If too few signals, decrease to 55. Quality vs. quantity tradeoff.
Q: Do regular divergences mean I should enter a reversal trade immediately
A: No. Regular divergences indicate momentum exhaustion, which is a WARNING sign that trend may reverse, not a confirmation that it will. Use confluence score, market context, support/resistance, and your strategy rules to make entry decisions. Many divergences fail.
Q: What's the difference between regular and hidden divergence
A: Regular divergence = price and momentum move in opposite directions at extremes = potential reversal signal. Hidden divergence = price and momentum move in opposite directions during pullbacks = potential continuation signal. Hidden divergence suggests the pullback is just a correction within the larger trend.
Q: Why does the pressure zone color sometimes conflict with the divergence direction
A: Pressure is real-time current bar analysis. Divergence is confirmed pivot analysis from the past. They measure different things at different times. A bullish divergence confirmed 3 bars ago might appear during current selling pressure. This is normal.
Q: Can I use this on stocks without volume data
A: No. Volume is required for pressure analysis and behavioral pattern detection. Use only on assets with reliable volume reporting.
Q: How often should I expect signals
A: Depends on timeframe and settings. Daily charts might produce 5-10 signals per month. 1-hour charts might produce 20-30. 15-minute charts might produce 50-100. Adjust confluence threshold to control frequency.
Q: Can I modify the code
A: Yes, this is open source. You can modify for personal use. If you publish a modified version, please credit the original and ensure your publication meets TradingView guidelines.
Q: What if I disagree with a pattern's confluence score
A: The scoring weights are based on general observations and may not suit your specific strategy or asset. You can modify the code to adjust weights if you have data-driven reasons to do so.
Final Notes
VMDM - Volume, Momentum and Divergence Master is an educational multi-layer market analysis system designed to teach systematic pattern recognition through transparent, confluence-weighted signal detection. By combining RSI momentum divergence, volume pressure quantification, behavioral footprint pattern recognition, and quality scoring into a unified framework, it provides a comprehensive learning environment for understanding market structure.
Use this tool to develop your analytical skills, understand how multiple technical factors interact, and learn to distinguish high-quality setups from noise. Remember that technical analysis is probabilistic, not predictive. No indicator replaces proper education, risk management, and trading discipline.
Trade responsibly. Learn continuously. Risk only what you can afford to lose.
-BullByte

Smarter Money Concepts Dashboard [PhenLabs]📊Smarter Money Concepts Dashboard
Version: PineScript™v6
📌Description
The Smarter Money Concepts Dashboard is a comprehensive institutional trading analysis tool that combines six of our most powerful smarter money concepts indicators into one unified suite. This advanced system automatically detects and visualizes Fair Value Gaps, Inverted FVGs, Order Blocks, Wyckoff Springs/Upthrusts, Wick Rejection patterns, and ICT Market Structure analysis.
Built for serious traders who need institutional-grade market analysis, this dashboard eliminates subjective interpretation by automatically identifying where smart money is likely positioned. The integrated real-time dashboard provides instant status updates on all active patterns, making it easy to monitor market conditions at a glance.
🚀Points of Innovation
● Multi-Module Integration: Six different SMC concepts unified in one comprehensive system
● Real-Time Dashboard Display: Live tracking of all active patterns with customizable positioning
● Advanced Volume Filtering: Institutional volume confirmation across all pattern types
● Automated Pattern Management: Smart memory system prevents chart clutter while maintaining relevant zones
● Probability-Based Wyckoff Detection: Mathematical probability calculations for spring/upthrust patterns
● Dual FVG System: Both standard and inverted Fair Value Gap detection with equilibrium analysis
🔧Core Components
● Fair Value Gap Engine: Detects standard FVGs with volume confirmation and equilibrium line analysis
● Inverted FVG Module: Advanced IFVG detection using RVI momentum filtering for inversion confirmation
● Order Block System: Institutional order block identification with customizable mitigation methods
● Wyckoff Pattern Recognition: Automated spring and upthrust detection with probability scoring
● Wick Rejection Analysis: High-probability reversal patterns based on wick-to-body ratios
● ICT Market Structure: Simplified institutional concepts with commitment tracking
🔥Key Features
● Comprehensive Pattern Detection: All major SMC concepts in one indicator with automatic identification
● Volume-Confirmed Signals: Multiple volume filters ensure only institutional-grade patterns are highlighted
● Interactive Dashboard: Real-time status display with active pattern counts and module status
● Smart Memory Management: Automatic cleanup of old patterns while preserving relevant market zones
● Full Alert System: Complete notification coverage for all pattern types and signal generations
● Customizable Display Options: Adjustable colors, transparency, and positioning for all visual elements
🎨Visualization
● Color-Coded Zones: Distinct color schemes for bullish/bearish patterns across all modules
● Dynamic Box Extensions: Automatically extending zones until mitigation or invalidation
● Equilibrium Lines: Fair Value Gap midpoint analysis with dotted line visualization
● Signal Markers: Clear spring/upthrust signals with directional arrows and probability indicators
● Dashboard Table: Professional-grade status panel with module activation and pattern counts
● Candle Coloring: Wick rejection highlighting with transparency-based visual emphasis
📖Usage Guidelines
Fair Value Gap Settings
● Days to Analyze: Default 15, Range 1-100 - Controls historical FVG detection period
● Volume Filter: Enables institutional volume confirmation for gap validity
● Min Volume Ratio: Default 1.5 - Minimum volume spike required for gap recognition
● Show Equilibrium Lines: Displays FVG midpoint analysis for precise entry targeting
Order Block Configuration
● Scan Range: Default 25 bars - Lookback period for structure break identification
● Volume Filter: Institutional volume confirmation for order block validation
● Mitigation Method: Wick or Close-based invalidation for different trading styles
● Min Volume Ratio: Default 1.5 - Volume threshold for significant order block formation
Wyckoff Analysis Parameters
● S/R Lookback: Default 20 - Support/resistance calculation period for spring/upthrust detection
● Volume Spike Multiplier: Default 1.5 - Required volume increase for pattern confirmation
● Probability Threshold: Default 0.7 - Minimum probability score for signal generation
● ATR Recovery Period: Default 5 - Price recovery calculation for pattern strength assessment
Market Structure Settings
● Auto-Detect Zones: Automatic identification of high-volume thin zones
● Proximity Threshold: Default 0.20% - Price proximity requirements for zone interaction
● Test Window: Default 20 bars - Time period for zone commitment calculation
Display Customization
● Dashboard Position: Four corner options for optimal chart layout
● Text Size: Scalable from Tiny to Large for different screen configurations
● Pattern Colors: Full customization of all bullish and bearish zone colors
✅Best Use Cases
● Swing Trading: Identify major institutional zones for multi-day position entries
● Day Trading: Precise intraday entries at Fair Value Gaps and Order Block boundaries
● Trend Analysis: Market structure confirmation for directional bias establishment
● Risk Management: Clear invalidation levels provided by all pattern boundaries
● Multi-Timeframe Analysis: Works across all timeframes from 1-minute to monthly charts
⚠️Limitations
● Market Condition Dependency: Performance varies between trending and ranging market environments
● Volume Data Requirements: Requires accurate volume data for optimal pattern confirmation
● Lagging Nature: Some patterns confirmed after initial price movement has begun
● Pattern Density: High-volatility markets may generate excessive pattern signals
● Educational Tool: Requires understanding of smart money concepts for effective application
💡What Makes This Unique
● Complete SMC Integration: First indicator to combine all major smart money concepts comprehensively
● Real-Time Dashboard: Instant visual feedback on all active institutional patterns
● Advanced Volume Analysis: Multi-layered volume confirmation across all detection modules
● Probability-Based Signals: Mathematical approach to Wyckoff pattern recognition accuracy
● Professional Memory Management: Sophisticated pattern cleanup without losing market relevance
🔬How It Works
1. Pattern Detection Phase:
● Multi-timeframe scanning for institutional footprints across all enabled modules
● Volume analysis integration confirms patterns meet institutional trading criteria
● Real-time pattern validation ensures only high-probability setups are displayed
2. Signal Generation Process:
● Automated zone creation with precise boundary definitions for each pattern type
● Dynamic extension system maintains relevance until mitigation or invalidation occurs
● Alert system activation provides immediate notification of new pattern formations
3. Dashboard Update Cycle:
● Live status monitoring tracks all active patterns and module states continuously
● Pattern count updates provide instant feedback on current market condition density
● Commitment tracking for market structure analysis shows institutional engagement levels
💡Note:
This indicator represents institutional trading concepts and should be used as part of a comprehensive trading strategy. Pattern recognition accuracy improves with understanding of smart money principles. Combine with proper risk management and multiple confirmation methods for optimal results.

🚀 Ultimate Trading Tool + Strat Method🚀 Ultimate Trading Tool + Strat Method - Complete Breakdown
Let me give you a comprehensive overview of this powerful indicator!
🎯 What This Indicator Does:
This is a professional-grade, all-in-one trading system that combines two proven methodologies:
1️⃣ Technical Analysis System (Original)
Advanced trend detection using multiple EMAs
Momentum analysis with MACD
RSI multi-timeframe analysis
Volume surge detection
Automated trendline drawing
2️⃣ Strat Method (Pattern Recognition)
Inside bars, outside bars, directional bars
Classic patterns: 2-2, 1-2-2
Advanced patterns: 3-1-2, 2-1-2, F2→3
Timeframe continuity filters
📊 How It Generates Signals:
Technical Analysis Signals (Green/Red Triangles):
Buy Signal Triggers When:
✅ Price above EMA 21 & 50 (uptrend)
✅ MACD histogram rising (momentum)
✅ RSI between 30-70 (not overbought/oversold)
✅ Volume surge above 20-period average
✅ Price breaks above resistance trendline
Scoring System:
Trend alignment: +1 point
Momentum: +1 point
RSI favorable: +1 point
Trendline breakout: +2 points
Minimum score required based on sensitivity setting
Strat Method Signals (Blue/Orange Labels):
Pattern Recognition:
2-2 Setup: Down bar → Up bar (or reverse)
1-2-2 Setup: Inside bar → Down bar → Up bar
3-1-2 Setup: Outside bar → Inside bar → Up bar
2-1-2 Setup: Down bar → Inside bar → Up bar
F2→3 Setup: Failed directional bar becomes outside bar
Confirmation Required:
Must break previous bar's high (buy) or low (sell)
Optional timeframe continuity (daily & weekly aligned)
💰 Risk Management Features:
Dynamic Stop Loss & Take Profit:
ATR-Based: Adapts to market volatility
Stop Loss: Entry - (ATR × 1.5) by default
Take Profit: Entry + (ATR × 3.0) by default
Risk:Reward: Customizable 1:2 to 1:5 ratios
Visual Risk Zones:
Colored boxes show risk/reward area
Dark, bold lines for easy identification
Clear entry, stop, and target levels
🎨 What You See On Screen:
Main Signals:
🟢 Green Triangle "BUY" - Technical analysis long signal
🔴 Red Triangle "SELL" - Technical analysis short signal
🎯 Blue Label "STRAT" - Strat method long signal
🎯 Orange Label "STRAT" - Strat method short signal
Trendlines:
Green lines - Support trendlines (bullish)
Red lines - Resistance trendlines (bearish)
Automatically drawn from pivot points
Extended forward to predict future levels
Stop/Target Levels:
Bold crosses at stop loss levels (red color)
Bold crosses at take profit levels (green color)
Line width = 3 for maximum visibility
Trade Zones:
Light green boxes - Long trade risk/reward zone
Light red boxes - Short trade risk/reward zone
Shows potential profit vs risk visually
📊 Information Dashboard (Top Right):
Shows real-time market conditions:
Main Signal: Current technical signal status
Strat Method: Active Strat pattern
Trend: Bullish/Bearish/Neutral
Momentum: Strong/Weak based on MACD
Volume: High/Normal compared to average
TF Continuity: Daily/Weekly alignment
RSI: Current RSI value with color coding
Support/Resistance: Current trendline levels
🔔 Alert System:
Entry Alerts:
Technical Signals:
🚀 BUY SIGNAL TRIGGERED!
Type: Technical Analysis
Entry: 45.23
Stop: 43.87
Target: 48.95
```
**Strat Signals:**
```
🎯 STRAT BUY TRIGGER!
Pattern: 3-1-2
Entry: 45.23
Trigger Level: 44.56
Exit Alerts:
Target hit notifications
Stop loss hit warnings
Helps maintain discipline
⚙️ Customization Options:
Signal Settings:
Sensitivity: High/Medium/Low (controls how many signals)
Volume Filter: Require volume surge or not
Momentum Filter: Require momentum confirmation
Strat Settings:
TF Continuity: Require daily/weekly alignment
Pattern Selection: Enable/disable specific patterns
Confirmation Mode: Show only confirmed triggers
Risk Settings:
ATR Multiplier: Adjust stop/target distance
Risk:Reward: Set preferred ratio
Visual Elements: Show/hide any component
Visual Settings:
Colors: Customize all signal colors
Display Options: Toggle signals, levels, zones
Trendline Length: Adjust pivot detection period
🎯 Best Use Cases:
Day Trading:
Use low sensitivity setting
Enable all Strat patterns
Watch for high volume signals
Quick in/out trades
Swing Trading:
Use medium sensitivity
Require timeframe continuity
Focus on trendline breakouts
Hold for target levels
Position Trading:
Use high sensitivity (fewer signals)
Require strong momentum
Focus on weekly/daily alignment
Larger ATR multipliers
💡 Trading Strategy Tips:
High-Probability Setups:
Double Confirmation: Technical + Strat signal together
Trend Alignment: All timeframes agree
Volume Surge: Institutional participation
Trendline Break: Clear level breakout
Risk Management:
Always use stops - System provides them
Position sizing - Risk 1-2% per trade
Don't chase - Wait for signal confirmation
Take profits - System provides targets
What Makes Signals Strong:
✅ Both technical AND Strat signals fire together
✅ Timeframe continuity (daily & weekly aligned)
✅ Volume surge confirms institutional interest
✅ Multiple indicators align (trend + momentum + RSI)
✅ Clean trendline breakout with no resistance above (or support below)
⚠️ Common Mistakes to Avoid:
Don't ignore stops - System calculates them for a reason
Don't overtrade - Wait for quality setups
Don't disable volume filter - Unless you know what you're doing
Don't use max sensitivity - You'll get too many signals
Don't ignore timeframe continuity - It filters bad trades
🚀 Why This Indicator is Powerful:
Combines Multiple Edge Sources:
Technical analysis (trend, momentum, volume)
Pattern recognition (Strat method)
Risk management (dynamic stops/targets)
Market structure (trendlines, support/resistance)
Professional Features:
No repainting - signals are final when bar closes
Clear risk/reward before entry
Multiple confirmation layers
Adaptable to any market or timeframe
Beginner Friendly:
Clear visual signals
Automatic calculations
Built-in risk management
Comprehensive dashboard
This indicator essentially gives you everything a professional trader uses - trend analysis, momentum, patterns, volume, risk management - all in one clean package!
Any specific aspect you'd like me to explain in more detail? 🎯RetryClaude can make mistakes. Please double-check responses. Sonnet 4.5

Turtle Soup Model [PhenLabs]📊 Turtle Soup Model
Version: PineScript™ v6
Description
The Turtle Soup Model is an innovative technical analysis tool that combines market structure analysis with inter-market comparison and gap detection. Unlike traditional structure indicators, it validates market movements against a comparison symbol (default: ES1!) to identify high-probability trading opportunities. The indicator features a unique “soup pattern” detection system, comprehensive gap analysis, and real-time structure breaks visualization.
Innovation Points:
First indicator to combine structure analysis with gap detection and inter-market validation
Advanced memory management system for efficient long-term analysis
Sophisticated pattern recognition with multi-market confirmation
Real-time structure break detection with comparative validation
🔧 Core Components
Structure Analysis: Advanced pivot detection with inter-market validation
Gap Detection: Sophisticated gap identification and classification system
Inversion Patterns: “Soup pattern” recognition for reversal opportunities
Visual System: Dynamic rendering of structure levels and gaps
Alert Framework: Multi-condition notification system
🚨 Key Features 🚨
The indicator provides comprehensive analysis through:
Structure Levels: Validated support and resistance zones
Gap Patterns: Identification of significant market gaps
Inversion Signals: Detection of potential reversal points
Real-time Comparison: Continuous inter-market analysis
Visual Alerts: Dynamic structure break notifications
📈 Visualization
Structure Lines: Color-coded for highs and lows
Gap Boxes: Visual representation of gap zones
Inversion Patterns: Clear marking of potential reversal points
Comparison Overlay: Inter-market divergence visualization
Alert Indicators: Visual signals for structure breaks
💡Example
📌 Usage Guidelines
The indicator offers multiple customization options:
Structure Settings:
Pivot Period: Adjustable for different market conditions
Comparison Symbol: Customizable reference market
Visual Style: Configurable colors and line widths
Gap Analysis:
Signal Mode: Choice between close and wick-based signals
Box Rendering: Automatic gap zone visualization
Middle Line: Reference point for gap measurements
✅ Best Practices:
🚨Use comparison symbol from related market🚨
Monitor both structure breaks and gap inversions
Combine signals for higher probability trades
Pay attention to inter-market divergences
⚠️ Limitations
Requires comparison symbol data
Performance depends on market correlation
Best suited for liquid markets
What Makes This Unique
Inter-market Validation: Uses comparison symbol for signal confirmation
Gap Integration: Combines structure and gap analysis
Soup Pattern Detection: Identifies specific reversal patterns
Dynamic Structure Management: Automatically updates and removes invalid levels
Memory-Efficient Design: Optimized for long-term chart analysis
🔧 How It Works
The indicator processes market data through three main components:
1. Structure Analysis:
Detects pivot points with comparison validation
Tracks structure levels with array management
Identifies and processes structure breaks
2. Gap Analysis:
Identifies significant market gaps
Processes gap inversions
Manages gap zones visualization
3. Pattern Recognition:
Detects “soup” patterns
Validates with comparison market
Generates structure break signals
💡 Note: The indicator performs best when used with correlated comparison symbols and appropriate timeframe selection. Its unique inter-market validation system provides additional confirmation for traditional structure-based trading strategies.

IU Indicators DashboardDESCRIPTION
The IU Indicators Dashboard is a comprehensive multi-stock monitoring tool that provides real-time technical analysis for up to 10 different stocks simultaneously. This powerful indicator creates a customizable table overlay that displays the trend status of multiple technical indicators across your selected stocks, giving you an instant overview of market conditions without switching between charts.
Perfect for portfolio monitoring, sector analysis, and quick market screening, this dashboard consolidates critical technical data into one easy-to-read interface with color-coded trend signals.
USER INPUTS
Stock Selection (10 Configurable Stocks):
- Stock 1-10: Customize any symbols (Default: NSE:CDSL, NSE:RELIANCE, NSE:VEDL, NSE:TCS, NSE:BEL, NSE:BHEL, NSE:TATAPOWER, NSE:TATASTEEL, NSE:ITC, NSE:LT)
Technical Indicator Parameters:
- EMA 1 Length: First Exponential Moving Average period (Default: 20)
- EMA 2 Length: Second Exponential Moving Average period (Default: 50)
- EMA 3 Length: Third Exponential Moving Average period (Default: 200)
- RSI Length: Relative Strength Index calculation period (Default: 14)
- SuperTrend Length: SuperTrend indicator period (Default: 10)
- SuperTrend Factor: SuperTrend multiplier factor (Default: 3.0)
Visual Customization:
- Table Size: Choose from Normal, Tiny, Small, or Large
- Table Background Color: Customize dashboard background
- Table Frame Color: Set frame border color
- Table Border Color: Configure border styling
- Text Color: Set text display color
- Bullish Color: Color for positive/bullish signals (Default: Green)
- Bearish Color: Color for negative/bearish signals (Default: Red)
LOGIC OF THE INDICATOR
The dashboard employs a multi-timeframe analysis approach using five key technical indicators:
1. Triple EMA Analysis
- Compares current price against three different EMA periods (20, 50, 200)
- Bullish Signal: Price above EMA level
- Bearish Signal: Price below EMA level
- Provides short-term, medium-term, and long-term trend perspective
2. RSI Momentum Analysis
- Uses 14-period RSI with 50-level threshold
- Bullish Signal: RSI > 50 (upward momentum)
- Bearish Signal: RSI < 50 (downward momentum)
- Identifies momentum strength and potential reversals
3. SuperTrend Direction
- Utilizes SuperTrend with configurable length and factor
- Bullish Signal: SuperTrend direction = -1 (uptrend)
- Bearish Signal: SuperTrend direction = 1 (downtrend)
- Provides clear trend direction with volatility-adjusted signals
4. MACD Histogram Analysis
- Uses standard MACD (12, 26, 9) histogram values
- Bullish Signal: Histogram > 0 (bullish momentum)
- Bearish Signal: Histogram < 0 (bearish momentum)
- Identifies momentum shifts and trend confirmations
5. Real-time Data Processing
- Implements request.security() for multi-symbol data retrieval
- Uses barstate.isrealtime logic for accurate live data
- Processes data only on the last bar for optimal performance
WHY IT IS UNIQUE
Multi-Stock Monitoring
- Monitor up to 10 different stocks simultaneously on a single chart
- No need to switch between multiple charts or timeframes
Highly Customizable Interface
- Full color customization for personalized visual experience
- Adjustable table size and positioning
- Clean, professional dashboard design
Real-time Analysis
- Live data processing with proper real-time handling
- Instant visual feedback through color-coded signals
- Optimized performance with smart data retrieval
Comprehensive Technical Coverage
- Combines trend-following, momentum, and volatility indicators
- Multiple timeframe perspective through different EMA periods
- Balanced approach using both lagging and leading indicators
Flexible Configuration
- Easy symbol switching for different markets (NSE, BSE, NYSE, NASDAQ)
- Adjustable indicator parameters for different trading styles
- Suitable for both swing trading and position trading
HOW USERS CAN BENEFIT FROM IT
Portfolio Management
- Quick Portfolio Health Check: Instantly assess the technical status of your entire stock portfolio
- Diversification Analysis: Monitor stocks across different sectors to ensure balanced exposure
- Risk Management: Identify which positions are showing bearish signals for potential exit strategies
- Rebalancing Decisions: Spot strongest performers for potential position increases
Market Screening and Analysis
- Sector Rotation: Compare different sector stocks to identify rotation opportunities
- Relative Strength Analysis: Quickly identify which stocks are outperforming or underperforming
- Market Breadth Assessment: Gauge overall market sentiment by monitoring diverse stock selections
- Trend Confirmation: Validate market trends by observing multiple stock behaviors
Time-Efficient Trading
- Single-Glance Analysis: Get complete technical overview without chart-hopping
- Pre-Market Preparation: Quickly assess overnight changes across multiple positions
- Intraday Monitoring: Track multiple opportunities simultaneously during trading hours
- End-of-Day Review: Efficiently review all watched stocks for next-day planning
Strategic Decision Making
- Entry Point Identification: Spot stocks showing bullish alignment across multiple indicators
- Exit Signal Recognition: Identify positions showing deteriorating technical conditions
- Swing Trading Opportunities: Find stocks with favorable technical setups for swing trades
- Long-term Investment Guidance: Use 200 EMA signals for long-term position decisions
Educational Benefits
- Pattern Recognition: Learn how different indicators behave across various market conditions
- Correlation Analysis: Understand how stocks move relative to each other
- Technical Analysis Learning: Observe multiple indicator interactions in real-time
- Market Sentiment Understanding: Develop better market timing skills through multi-stock observation
Workflow Optimization
- Reduced Chart Clutter: Keep your main chart clean while monitoring multiple stocks
- Faster Analysis: Complete technical analysis of 10 stocks in seconds instead of minutes
- Consistent Methodology: Apply the same technical criteria across all monitored stocks
- Alert Integration: Easy visual identification of stocks requiring immediate attention
This indicator is designed for traders and investors who want to maximize their market awareness while minimizing analysis time. Whether you're managing a portfolio, screening for opportunities, or learning technical analysis, the IU Indicators Dashboard provides the comprehensive overview you need for better trading decisions.
DISCLAIMER :
This indicator is not financial advice, it's for educational purposes only highlighting the power of coding( pine script) in TradingView, I am not a SEBI-registered advisor. Trading and investing involve risk, and you should consult with a qualified financial advisor before making any trading decisions. I do not guarantee profits or take responsibility for any losses you may incur.

Elliott's Quadratic Momentum - Strategy [presentTrading]█ Introduction and How It Is Different
The "Elliott's Quadratic Momentum - Strategy" is a unique and innovative approach in the realm of technical trading. This strategy is a fusion of multiple SuperTrend indicators combined with an Elliott Wave-like pattern analysis, offering a comprehensive and dynamic trading tool. It stands apart from conventional strategies by incorporating multiple layers of trend analysis, thereby providing a more robust and nuanced view of market movements.
*Although the script doesn't explicitly analyze Elliott Wave patterns, it employs a wave-like approach by considering multiple SuperTrend indicators. Elliott Wave theory is based on the premise that markets move in predictable wave patterns. While this script doesn't identify specific Elliott Wave structures like impulsive and corrective waves, the sequential checking of trend conditions across multiple SuperTrend indicators mimics a wave-like progression.
BTC 8hr Long/Short Performance
Local Detail
█ Strategy, How It Works: Detailed Explanation
The core of this strategy lies in its multi-tiered approach:
1. Multiple SuperTrend Indicators:
The strategy employs four different SuperTrend indicators, each with unique ATR lengths and multipliers. These indicators offer various perspectives on market trends, ranging from short to long-term views.
By analyzing the convergence of these indicators, the strategy can pinpoint robust entry signals for both long and short positions.
2. Elliott Wave-like Pattern Recognition:
While not directly applying Elliott Wave theory, the strategy takes inspiration from its pattern recognition approach. It looks for alignments in market movements that resemble the characteristic waves of Elliott's theory.
This pattern recognition aids in confirming the signals provided by the SuperTrend indicators, adding an extra layer of validation to the trading signals.
3. Comprehensive Market Analysis:
By combining multiple indicators and pattern analysis, the strategy offers a holistic view of the market. This allows for capturing potential trend reversals and significant market moves early.
█ Trade Direction
The strategy is designed with flexibility in mind, allowing traders to select their preferred trading direction – Long, Short, or Both. This adaptability is key for traders looking to tailor their approach to different market conditions or personal trading styles. The strategy automatically adjusts its logic based on the chosen direction, ensuring that traders are always aligned with their strategic objectives.
█ Usage
To utilize the "Elliott's Quadratic Momentum - Strategy" effectively:
Traders should first determine their trading direction and adjust the SuperTrend settings according to their market analysis and risk appetite.
The strategy is versatile and can be applied across various time frames and asset classes, making it suitable for a wide range of trading scenarios.
It's particularly effective in trending markets, where the alignment of multiple SuperTrend indicators can provide strong trade signals.
█ Default Settings
Trading Direction: Configurable (Long, Short, Both)
SuperTrend Settings:
SuperTrend 1: ATR Length 7, Multiplier 4.0
SuperTrend 2: ATR Length 14, Multiplier 3.618
SuperTrend 3: ATR Length 21, Multiplier 3.5
SuperTrend 4: ATR Length 28, Multiplier 3.382
Additional Settings: Gradient effect for trend visualization, customizable color schemes for upward and downward trends.

MA Crossover [AlchimistOfCrypto]🌌 MA Crossover Quantum – Illuminating Market Harmonic Patterns 🌌
Category: Trend Analysis Indicators 📈
"The moving average crossover, reinterpreted through quantum field principles, visualizes the underlying resonance structures of price movements. This indicator employs principles from molecular orbital theory where energy states transition through gradient fields, similar to how price momentum shifts between bullish and bearish phases. Our implementation features algorithmically optimized parameters derived from extensive Python-based backtesting, creating a visual representation of market energy flows with dynamic opacity gradients that highlight the catalytic moments where trend transformations occur."
📊 Professional Trading Application
The MA Crossover Quantum transcends the traditional moving average crossover with a sophisticated gradient illumination system that highlights the energy transfer between fast and slow moving averages. Scientifically optimized for multiple timeframes and featuring eight distinct visual themes, it enables traders to perceive trend transitions with unprecedented clarity.
⚙️ Indicator Configuration
- Timeframe Presets 📏
Python-optimized parameters for specific timeframes:
- 1H: EMA 23/395 - Ideal for intraday precision trading
- 4H: SMA 41/263 - Balanced for swing trading operations
- 1D: SMA 8/44 - Optimized for daily trend identification
- 1W: SMA 32/38 - Calibrated for medium-term position trading
- 2W: SMA 17/20 - Engineered for long-term investment signals
- Custom Settings 🎯
Full parameter customization available for professional traders:
- Fast/Slow MA Length: Fine-tune to specific market conditions
- MA Type: Select between EMA (exponential) and SMA (simple) calculation methods
- Visual Theming 🎨
Eight scientifically designed visual palettes optimized for neural pattern recognition:
- Neon (default): High-contrast green/red scheme enhancing trend transition visibility
- Cyan-Magenta: Vibrant palette for maximum visual distinction
- Yellow-Purple: Complementary colors for enhanced pattern recognition
- Specialized themes (Green-Red, Forest Green, Blue Ocean, Orange-Red, Grayscale): Each calibrated for different market environments
- Opacity Control 🔍
- Variable transparency system (0-100) allowing seamless integration with price action
- Adaptive glow effect that intensifies around crossover points - the "catalytic moments" of trend change
🚀 How to Use
1. Select Timeframe ⏰: Choose from scientifically optimized presets based on your trading horizon
2. Customize Parameters 🎚️: For advanced users, disable presets to fine-tune MA settings
3. Choose Visual Theme 🌈: Select a color scheme that enhances your personal pattern recognition
4. Adjust Opacity 🔎: Fine-tune visualization intensity to complement your chart analysis
5. Identify Trend Changes ✅: Monitor gradient intensity to spot high-probability transition zones
6. Trade with Precision 🛡️: Use gradient intensity variations to determine position sizing and risk management
Developed through rigorous mathematical modeling and extensive backtesting, MA Crossover Quantum transforms the fundamental moving average crossover into a sophisticated visual analysis tool that reveals the molecular structure of market momentum.

Fibonacci-Only Strategy V2Fibonacci-Only Strategy V2
This strategy combines Fibonacci retracement levels with pattern recognition and statistical confirmation to identify high-probability trading opportunities across multiple timeframes.
Core Strategy Components:
Fibonacci Levels: Uses key Fibonacci retracement levels (19% and 82.56%) to identify potential reversal zones
Pattern Recognition: Analyzes recent price patterns to find similar historical formations
Statistical Confirmation: Incorporates statistical analysis to validate entry signals
Risk Management: Includes customizable stop loss (fixed or ATR-based) and trailing stop features
Entry Signals:
Long entries occur when price touches or breaks the 19% Fibonacci level with bullish confirmation
Short entries require Fibonacci level interaction, bearish confirmation, and statistical validation
All signals are visually displayed with color-coded markers and dashboard
Trading Method:
When a triangle signal appears, open a position on the next candle
Alternatively, after seeing a signal on a higher timeframe, you can switch to a lower timeframe to find a more precise entry point
Entry signals are clearly marked with visual indicators for easy identification
Risk Management Features:
Adjustable stop loss (percentage-based or ATR-based)
Optional trailing stops for protecting profits
Multiple take-profit levels for strategic position exit
Customization Options:
Timeframe selection (1m to Daily)
Pattern length and similarity threshold adjustment
Statistical period and weight configuration
Risk parameters including stop loss and trailing stop settings
This strategy is particularly well-suited for cryptocurrency markets due to their tendency to respect Fibonacci levels and technical patterns. Crypto's volatility is effectively managed through the customizable stop-loss and trailing-stop mechanisms, making it an ideal tool for traders in digital asset markets.
For optimal performance, this strategy works best on higher timeframes (30m, 1h and above) and is not recommended for low timeframe scalping. The Fibonacci pattern recognition requires sufficient price movement to generate reliable signals, which is more consistently available in medium to higher timeframes.
Users should avoid trading during sideways market conditions, as the strategy performs best during trending markets with clear directional movement. The statistical confirmation component helps filter out some sideways market signals, but it's recommended to manually avoid ranging markets for best results.

Smarter Money Concepts - OBs [PhenLabs]📊 Smarter Money Concepts - OBs
Version: PineScript™ v6
📌 Description
Smarter Money Concepts - OBs (Order Blocks) is an advanced technical analysis tool designed to identify and visualize institutional order zones on your charts. Order blocks represent significant areas of liquidity where smart money has entered positions before major moves. By tracking these zones, traders can anticipate potential reversals, continuations, and key reaction points in price action.
This indicator incorporates volume filtering technology to identify only the most significant order blocks, eliminating low-quality signals and focusing on areas where institutional participation is likely present. The combination of price structure analysis and volume confirmation provides traders with high-probability zones that may attract future price action for tests, rejections, or breakouts.
🚀 Points of Innovation
Volume-Filtered Block Detection : Identifies only order blocks formed with significant volume, focusing on areas with institutional participation
Advanced Break of Structure Logic : Uses sophisticated price action analysis to detect legitimate market structure breaks preceding order blocks
Dynamic Block Management : Intelligently tracks, extends, and removes order blocks based on price interaction and time-based expiration
Structure Recognition System : Employs technical analysis algorithms to find significant swing points for accurate order block identification
Dual Directional Tracking : Simultaneously monitors both bullish and bearish order blocks for comprehensive market structure analysis
🔧 Core Components
Order Block Detection : Identifies institutional entry zones by analyzing price action before significant breaks of structure, capturing where smart money has likely positioned before moves.
Volume Filtering Algorithm : Calculates relative volume compared to a moving average to qualify only order blocks formed with significant market participation, eliminating noise.
Structure Break Recognition : Uses price action analysis to detect legitimate breaks of market structure, ensuring order blocks are identified only at significant market turning points.
Dynamic Block Management : Continuously monitors price interaction with existing blocks, extending, maintaining, or removing them based on current market behavior.
🔥 Key Features
Volume-Based Filtering : Filter out insignificant blocks by requiring a minimum volume threshold, focusing only on zones with likely institutional activity
Visual Block Highlighting : Color-coded boxes clearly mark bullish and bearish order blocks with customizable appearance
Flexible Mitigation Options : Choose between “Wick” or “Close” methods for determining when a block has been tested or mitigated
Scan Range Adjustment : Customize how far back the indicator looks for structure points to adapt to different market conditions and timeframes
Break Source Selection : Configure which price component (close, open, high, low) is used to determine structure breaks for precise block identification
🎨 Visualization
Bullish Order Blocks : Blue-colored rectangles highlighting zones where bullish institutional orders were likely placed before upward moves, representing potential support areas.
Bearish Order Blocks : Red-colored rectangles highlighting zones where bearish institutional orders were likely placed before downward moves, representing potential resistance areas.
Block Extension : Order blocks extend to the right of the chart, providing clear visualization of these significant zones as price continues to develop.
📖 Usage Guidelines
Order Block Settings
Scan Range : Default: 25. Defines how many bars the indicator scans to determine significant structure points for order block identification.
Bull Break Price Source : Default: Close. Determines which price component is used to detect bullish breaks of structure.
Bear Break Price Source : Default: Close. Determines which price component is used to detect bearish breaks of structure.
Visual Settings
Bullish Blocks Color : Default: Blue with 85% transparency. Controls the appearance of bullish order blocks.
Bearish Blocks Color : Default: Red with 85% transparency. Controls the appearance of bearish order blocks.
General Options
Block Mitigation Method : Default: Wick, Options: Wick, Close. Determines how block mitigation is calculated - “Wick” uses high/low values while “Close” uses close values for more conservative mitigation criteria.
Remove Filled Blocks : Default: Disabled. When enabled, order blocks are removed once they’ve been mitigated by price action.
Volume Filter
Volume Filter Enabled : Default: Enabled. When activated, only shows order blocks formed with significant volume relative to recent average.
Volume SMA Period : Default: 15, Range: 1-50. Number of periods used to calculate the average volume baseline.
Min. Volume Ratio : Default: 1.5, Range: 0.5-10.0. Minimum volume ratio compared to average required to display an order block; higher values filter out more blocks.
✅ Best Use Cases
Identifying high-probability support and resistance zones for trade entries and exits
Finding optimal stop-loss placement behind significant order blocks
Detecting potential reversal areas where price may react after extended moves
Confirming breakout trades when price clears major order blocks
Building a comprehensive market structure map for medium to long-term trading decisions
Pinpointing areas where smart money may have positioned before major market moves
⚠️ Limitations
Most effective on higher timeframes (1H and above) where institutional activity is more clearly defined
Can generate multiple signals in choppy market conditions, requiring additional filtering
Volume filtering relies on accurate volume data, which may be less reliable for some securities
Recent market structure changes may invalidate older order blocks not yet automatically removed
Block identification is based on historical price action and may not predict future behavior with certainty
💡 What Makes This Unique
Volume Intelligence : Unlike basic order block indicators, this script incorporates volume analysis to identify only the most significant institutional zones, focusing on quality over quantity.
Structural Precision : Uses sophisticated break of structure algorithms to identify true market turning points, going beyond simple price pattern recognition.
Dynamic Block Management : Implements automatic block tracking, extension, and cleanup to maintain a clean and relevant chart display without manual intervention.
Institutional Focus : Designed specifically to highlight areas where smart money has likely positioned, helping retail traders align with institutional perspectives rather than retail noise.
🔬 How It Works
1. Structure Identification Process :
The indicator continuously scans price action to identify significant swing points and structure levels within the specified range, establishing a foundation for order block recognition.
2. Break Detection :
When price breaks an established structure level (crossing below a significant low for bearish breaks or above a significant high for bullish breaks), the indicator marks this as a potential zone for order block formation.
3. Volume Qualification :
For each potential order block, the algorithm calculates the relative volume compared to the configured period average. Only blocks formed with volume exceeding the minimum ratio threshold are displayed.
4. Block Creation and Management :
Valid order blocks are created, tracked, and managed as price continues to develop. Blocks extend to the right of the chart until they are either mitigated by price action or expire after the designated timeframe.
5. Continuous Monitoring :
The indicator constantly evaluates price interaction with existing blocks, determining when blocks have been tested, mitigated, or invalidated, and updates the visual representation accordingly.
💡 Note:
Order Blocks represent areas where institutional traders have likely established positions and may defend these zones during future price visits. For optimal results, use this indicator in conjunction with other confluent factors such as key support/resistance levels, trendlines, or additional confirmation indicators. The most reliable signals typically occur on higher timeframes where institutional activity is most prominent. Start with the default settings and adjust parameters gradually to match your specific trading instrument and style.

Real-Time Spring DetectorThis is a Pine Script for Trading View that creates a "Real-Time Spring Detector" indicator. This Pine Script is essentially a sophisticated pattern recognition tool that helps identify "spring" setups - a popular trading pattern where price briefly breaks below support but then bounces back strongly, often indicating that sellers are exhausted and buyers are ready to step in.What is a "Spring" in Trading?
A spring is a technical analysis pattern that occurs when:
Price breaks below a support level (like breaking below a floor)
But then quickly bounces back up (like a spring rebounds)
This often signals that sellers are weak and buyers are stepping in
Think of it like testing the strength of a trampoline - you push down, but it springs back up stronger.
What This Script Does
This Pine Script automatically detects spring patterns on your chart and alerts you when they happen. Here's how it works:
Main Components
1. Input Parameters (Settings You Can Adjust)
Lookback Period (10): How many bars back to look for patterns
Min Support Touches (2): How many times price must touch the support level
Min Penetration % (0.1%): How far below support price must break
Min Rejection % (30%): How much price must bounce back up
Alert Settings: Choose when to get notifications
2. Support Level Detection
The script finds "support levels" - price levels where buyers have stepped in before:
It looks at recent low points
Identifies areas where price has bounced multiple times
Uses a small tolerance (0.5%) to account for minor price differences
3. Spring Detection Logic
The script identifies three types of springs:
Real-Time Spring (happening right now):
Price breaks below support by the minimum amount
Price bounces back strongly (rejection %)
Current candle closes higher than it opened (bullish)
Volume is reasonable
Confirmed Spring (already completed):
Same as real-time, but the candle has finished forming
Potential Spring (early warning):
Price is near support but hasn't fully formed the pattern yet
4. Visual Elements
Markers on Chart:
🟢 Green Triangle: Confirmed spring (reliable signal)
🟡 Yellow Triangle: Spring forming right now (live signal)
🟠 Orange Circle: Potential spring (early warning)
Labels:
Show "SPRING" with the rejection percentage
"FORMING" for developing patterns
"?" for potential springs
Support Line:
Red dotted line showing the support level
Background Colors:
Light red when price penetrates support
Light yellow for potential springs
5. Information Box
A table in the top-left corner shows:
Current support level price
Whether penetration is happening
Rejection percentage
Current pattern status
Live price
6. Alert System
Two types of alerts:
Real-time alerts: Notify when spring is forming (current bar)
Confirmed alerts: Notify when spring is complete (bar closed)
Alert cooldown: Prevents spam by waiting 5 bars between alerts
How to Use This Script
1. Installation
Copy the script code
Open TradingView
Go to Pine Editor
Paste the code
Click "Add to Chart"
2. Settings
Adjust the input parameters based on your trading style:
Lower lookback = more sensitive, faster signals
Higher support touches = more reliable but fewer signals
Lower penetration % = catches smaller springs
Higher rejection % = only strong bounces
3. Interpretation
Green triangles: High-confidence buy signals
Yellow triangles: Watch closely, pattern developing
Orange circles: Early warning, not tradeable yet
4. Best Practices
Use on higher timeframes (15min+) for more reliable signals
Combine with other indicators for confirmation
Pay attention to volume - higher volume springs are more reliable
Wait for confirmed signals if you're a conservative trader
Key Features for Small Timeframes
The script includes special detection for shorter timeframes:
Quick bounce detection: Identifies rapid reversals
Hammer pattern recognition: Spots candlestick patterns
Relaxed volume requirements: Works when volume data is limited
Advanced Features
Volume Analysis
Compares current volume to 10-bar average
Requires at least 80% of average volume (flexible for small timeframes)
Pattern Enhancement
Looks for hammer-like candles (long lower wick, small upper wick)
Identifies quick bounces where the upper wick is small
Multiple Confirmation
Combines multiple criteria to reduce false signals
Stronger springs get priority for alerts
Common Use Cases
Entry Signals: Buy when confirmed springs appear
Support Level Identification: Visual support lines help identify key levels
Risk Management: Failed springs (continued breakdown) can be stop-loss triggers
Market Structure: Understanding where buyers are defending price levels
Limitations
Works best in trending or ranging markets May produce false signals in very choppy conditions
small timeframe signals can be noisy should be combined with other analysis methods.The key advantage is that it can catch these patterns as they happen, rather than you having to constantly watch charts. This is especially valuable for active traders who want to capitalize on quick reversals at support levels.

Dkoderweb repainting issue fix strategyHarmonic Pattern Recognition Trading Strategy
This TradingView strategy called "Dkoderweb repainting issue fix strategy" is designed to identify and trade harmonic price patterns with optimized entry and exit points using Fibonacci levels. The strategy implements various popular harmonic patterns including Bat, Butterfly, Gartley, Crab, Shark, ABCD, and their anti-patterns.
Key Features
Pattern Recognition: Identifies 17+ harmonic price patterns including standard and anti-patterns
Fibonacci-Based Entries and Exits: Uses customizable Fibonacci levels for precision entries, take profits, and stop losses
Alternative Timeframe Analysis: Option to use higher timeframes for pattern identification
Heiken Ashi Support: Optional use of Heiken Ashi candles instead of regular candlesticks
Visual Indicators:
Pattern visualization with ZigZag indicator
Buy/sell signal markers
Color-coded background to highlight active trade zones
Customizable Fibonacci level display
How It Works
The strategy uses a ZigZag-based pattern identification system to detect pivot points
When a valid harmonic pattern forms, the strategy calculates the optimal entry window using the specified Fibonacci level (default 0.382)
Entries trigger when price returns to the entry window after pattern completion
Take profit and stop loss levels are automatically set based on customizable Fibonacci ratios
Visual alerts notify you of entries and exits
The strategy tracks active trades and displays them with background color highlights
Customizable Settings
Trade size
Entry window Fibonacci level (default 0.382)
Take profit Fibonacci level (default 0.618)
Stop loss Fibonacci level (default -0.618)
Alert messages for entries and exits
Display options for specific Fibonacci levels
Alternative timeframe selection
This strategy is designed to fix repainting issues that are common in harmonic pattern strategies, ensuring more reliable signals and backtesting results.

Psychological LevelsADVANCED PSYCHOLOGICAL LEVELS - PROFESSIONAL FOREX INDICATOR
This highly customizable indicator automatically identifies and visualizes all major psychological price levels across any Forex chart. Psychological levels represent critical price zones where traders naturally congregate their orders due to human psychology's attraction to round numbers. These levels consistently act as powerful support and resistance zones in the market.
🎯 KEY FEATURES:
✅ Four Distinct Level Types - Choose from 1000-pip, 100-pip, 50-pip, 25-pip, and 10-pip psychological levels
✅ Individual Color Customization - Each level type has its own customizable zone and line colors
✅ Separate Zone Width Control - Adjust zone width independently for each level type
✅ Universal Forex Compatibility - Automatically adapts to JPY pairs and all other currency pairs
✅ Extended Coverage - Displays levels far beyond the visible chart area for comprehensive analysis
✅ Fixed Positioning - Levels remain stationary when scrolling or zooming
✅ Fully Customizable Styling - Choose between solid, dashed, or dotted line styles
📊 LEVEL TYPES EXPLAINED:
🟣 1000-pip Levels (e.g., EUR/USD: 1.0000, 2.0000 | USD/JPY: 100.00, 110.00, 120.00)
The strongest macro-level psychological barriers in the Forex market
Represent massive institutional, long-term price zones
Extremely important for position traders, swing traders, and macro analysis
Used by hedge funds, banks, and large liquidity providers for major order placement
Ideal for identifying long-term support/resistance, trend reversals, and market structure shifts
Default color: Purple (highest, macro-level importance)
🔴 100-pip Levels (e.g., EUR/USD: 1.1000, 1.1100, 1.1200 | USD/JPY: 150.00, 151.00, 152.00)
The most significant psychological barriers in Forex trading
Major round numbers where institutional traders place large orders
Strongest support and resistance zones with highest reaction probability
Essential for swing trading and position trading strategies
Default color: Red (highest importance)
🟠 50-pip Levels (e.g., EUR/USD: 1.1050, 1.1150, 1.1250 | USD/JPY: 150.50, 151.50, 152.50)
Secondary psychological levels positioned midway between 100-pip levels
Important intermediate zones for profit-taking and order clustering
Highly effective for day trading strategies
Reliable targets for partial profit exits
Default color: Orange (medium-high importance)
🔵 25-pip Levels (e.g., EUR/USD: 1.1025, 1.1075, 1.1125 | USD/JPY: 150.25, 150.75, 151.25)
Quartile levels providing granular market structure
Perfect for scalping and short-term trading approaches
Excellent confluence zones with technical indicators
Ideal for tight stop-loss placement
Default color: Blue (medium importance)
🟢 10-pip Levels (e.g., EUR/USD: 1.1010, 1.1020, 1.1030 | USD/JPY: 150.10, 150.20, 150.30)
Most detailed psychological levels for precision trading
Optimal for micro scalping and high-frequency strategies
Provides fine-grained market structure analysis
Useful for optimizing entry and exit timing
Default color: Green (detailed analysis)
⚙️ CUSTOMIZATION OPTIONS:
Color Settings (Individual for Each Level):
Zone Color - Customize fill color with adjustable transparency
Line Color - Set center line color independently
Default color scheme uses traffic light logic (Purple → Red → Orange → Blue → Green)
Zone Width Settings (Separate for Each Level):
1000-pip Levels: Default 15 pips (widest zones for long-term significance)
100-pip Levels: Default 8 pips (wider zones for major levels)
50-pip Levels: Default 5 pips (medium zones)
25-pip Levels: Default 3 pips (smaller zones)
10-pip Levels: Default 2 pips (narrowest zones for precision)
Display Settings:
Line Style: Choose between Solid, Dashed, or Dotted
Line Thickness: Adjustable from 1 to 5 pixels
Level Selection: Toggle each level type on/off independently
💡 TRADING APPLICATIONS:
📈 Support & Resistance Identification
Instantly recognize where price is likely to react
Identify key reversal zones before they occur
Combine with price action for high-probability setups
🎯 Optimal Entry & Exit Points
Enter trades at psychological support/resistance
Set realistic profit targets at the next psychological level
Improve win rate by trading with market psychology
🛡️ Strategic Stop-Loss Placement
Position stops just beyond psychological levels to avoid stop hunts
Reduce premature stop-outs by understanding where others place stops
Protect profits by moving stops to psychological levels
💰 Profit Target Optimization
Set take-profit orders at psychological levels where profit-taking occurs
Scale out positions at multiple psychological levels
Maximize gains by understanding where demand/supply shifts
📊 Breakout Trading
Identify when price decisively breaks through major psychological barriers
Trade momentum when psychological levels are breached
Confirm breakouts using multiple level types as confluence
⚖️ Risk Management Enhancement
Calculate better risk-reward ratios using psychological levels
Size positions based on distance to next psychological level
Improve overall trading consistency
🔬 WHY PSYCHOLOGICAL LEVELS WORK:
Psychological levels are self-fulfilling prophecies in financial markets. Because thousands of traders worldwide monitor the same round numbers, these levels naturally attract significant order flow:
Order Clustering: Pending buy/sell orders accumulate at round numbers
Profit Taking: Traders instinctively close positions at psychological levels
Stop Hunts: Market makers often push price to psychological levels to trigger stops
Institutional Activity: Banks and funds use round numbers for large order placement
Pattern Recognition: Human brains naturally gravitate toward simple, round numbers
📋 TECHNICAL SPECIFICATIONS:
✓ Pine Script Version 6 (latest)
✓ Compatible with all Forex pairs (majors, minors, exotics)
✓ Works on all timeframes (M1 to Monthly)
✓ Automatic JPY pair detection and adjustment
✓ Maximum 500 lines and 500 boxes for optimal performance
✓ Levels extend infinitely across the chart
✓ No repainting - levels are fixed once drawn
✓ Efficient calculation prevents performance issues
✓ Clean visualization without chart clutter
👥 IDEAL FOR:
Day Traders: Use 100-pip and 50-pip levels for intraday setups
Swing Traders: Focus on major 100-pip levels for multi-day positions
Scalpers: Enable 25-pip and 10-pip levels for precision entries
Position Traders: Use 100-pip levels for long-term support/resistance analysis
Beginner Traders: Learn to recognize important market structure easily
Algorithm Developers: Incorporate psychological levels into automated strategies
🚀 HOW TO USE:
Add the indicator to any Forex chart
Select which level types you want to display (100, 50, 25, 10)
Customize colors to match your chart theme
Adjust zone widths based on your trading style and timeframe
Choose line style (solid, dashed, or dotted)
Watch for price reactions at the highlighted psychological zones
Use the levels to plan entries, exits, and stop-loss placement
💎 BEST PRACTICES:
✓ Combine with candlestick patterns for confirmation signals
✓ Wait for price action confirmation before entering trades
✓ Use multiple timeframes to identify the most significant levels
✓ Disable 10-pip levels on higher timeframes to reduce visual noise
✓ Enable only 100-pip levels for clean, uncluttered analysis on Daily/Weekly charts
✓ Adjust zone widths based on pair volatility (wider for volatile pairs)
✓ Use color coding to instantly recognize level importance
⚡ PERFORMANCE OPTIMIZED:
This indicator is engineered for maximum efficiency:
Smart calculation only within visible price range
Duplicate prevention system avoids overlapping levels
Optimized loops with early break conditions
Extended coverage (500 bars) without performance degradation
Handles thousands of levels across all timeframes smoothly
🎨 VISUAL DESIGN:
The default color scheme follows intuitive importance levels:
Purple (1000-pip): Macro-level, highest significance
Red (100-pip): Highest importance - major barriers
Orange (50-pip): Medium-high importance - secondary levels
Blue (25-pip): Medium importance - tertiary levels
Green (10-pip): Detailed analysis - precision levels
This traffic-light inspired system allows instant visual recognition of level significance.
📚 EDUCATIONAL VALUE:
Beyond being a trading tool, this indicator serves as an excellent educational resource for understanding market psychology and how professional traders think. It visually demonstrates where the "crowd" is likely to place orders, helping you develop better market intuition.
🔄 CONTINUOUS UPDATES:
This indicator displays levels dynamically based on the current price range, ensuring you always see relevant psychological levels no matter where price moves on the chart.
✨ WHAT MAKES THIS INDICATOR UNIQUE:
Unlike simple horizontal line indicators, this advanced tool offers:
Individual customization for each level type (colors, widths)
Automatic currency pair detection and adjustment
Visual zones (not just lines) for better support/resistance visualization
Extended coverage ensuring levels are always visible
Professional color-coding system for instant level importance recognition
Performance-optimized for handling hundreds of levels simultaneously
⭐ PERFECT FOR ALL TRADING STYLES:
Whether you're a conservative position trader looking at weekly charts or an aggressive scalper on 1-minute timeframes, this indicator adapts to your needs. Simply enable the appropriate level types and adjust the visualization to match your strategy.
Transform your Forex trading with professional-grade psychological level analysis. Add this indicator to your chart today and start trading with the market psychology on your side!

Psychological levelsADVANCED PSYCHOLOGICAL LEVELS - PROFESSIONAL FOREX INDICATOR
This highly customizable indicator automatically identifies and visualizes all major psychological price levels across any Forex chart. Psychological levels represent critical price zones where traders naturally congregate their orders due to human psychology's attraction to round numbers. These levels consistently act as powerful support and resistance zones in the market.
🎯 KEY FEATURES:
✅ Four Distinct Level Types - Choose from 100-pip, 50-pip, 25-pip, and 10-pip psychological levels
✅ Individual Color Customization - Each level type has its own customizable zone and line colors
✅ Separate Zone Width Control - Adjust zone width independently for each level type
✅ Universal Forex Compatibility - Automatically adapts to JPY pairs and all other currency pairs
✅ Extended Coverage - Displays levels far beyond the visible chart area for comprehensive analysis
✅ Fixed Positioning - Levels remain stationary when scrolling or zooming
✅ Fully Customizable Styling - Choose between solid, dashed, or dotted line styles
📊 LEVEL TYPES EXPLAINED:
🔴 100-pip Levels (e.g., EUR/USD: 1.1000, 1.1100, 1.1200 | USD/JPY: 150.00, 151.00, 152.00)
The most significant psychological barriers in Forex trading
Major round numbers where institutional traders place large orders
Strongest support and resistance zones with highest reaction probability
Essential for swing trading and position trading strategies
Default color: Red (highest importance)
🟠 50-pip Levels (e.g., EUR/USD: 1.1050, 1.1150, 1.1250 | USD/JPY: 150.50, 151.50, 152.50)
Secondary psychological levels positioned midway between 100-pip levels
Important intermediate zones for profit-taking and order clustering
Highly effective for day trading strategies
Reliable targets for partial profit exits
Default color: Orange (medium-high importance)
🔵 25-pip Levels (e.g., EUR/USD: 1.1025, 1.1075, 1.1125 | USD/JPY: 150.25, 150.75, 151.25)
Quartile levels providing granular market structure
Perfect for scalping and short-term trading approaches
Excellent confluence zones with technical indicators
Ideal for tight stop-loss placement
Default color: Blue (medium importance)
🟢 10-pip Levels (e.g., EUR/USD: 1.1010, 1.1020, 1.1030 | USD/JPY: 150.10, 150.20, 150.30)
Most detailed psychological levels for precision trading
Optimal for micro scalping and high-frequency strategies
Provides fine-grained market structure analysis
Useful for optimizing entry and exit timing
Default color: Green (detailed analysis)
⚙️ CUSTOMIZATION OPTIONS:
Color Settings (Individual for Each Level):
Zone Color - Customize fill color with adjustable transparency
Line Color - Set center line color independently
Default color scheme uses traffic light logic (Red → Orange → Blue → Green)
Zone Width Settings (Separate for Each Level):
100-pip Levels: Default 10 pips (wider zones for major levels)
50-pip Levels: Default 7 pips (medium zones)
25-pip Levels: Default 5 pips (smaller zones)
10-pip Levels: Default 3 pips (narrowest zones for precision)
Display Settings:
Line Style: Choose between Solid, Dashed, or Dotted
Line Thickness: Adjustable from 1 to 5 pixels
Level Selection: Toggle each level type on/off independently
💡 TRADING APPLICATIONS:
📈 Support & Resistance Identification
Instantly recognize where price is likely to react
Identify key reversal zones before they occur
Combine with price action for high-probability setups
🎯 Optimal Entry & Exit Points
Enter trades at psychological support/resistance
Set realistic profit targets at the next psychological level
Improve win rate by trading with market psychology
🛡️ Strategic Stop-Loss Placement
Position stops just beyond psychological levels to avoid stop hunts
Reduce premature stop-outs by understanding where others place stops
Protect profits by moving stops to psychological levels
💰 Profit Target Optimization
Set take-profit orders at psychological levels where profit-taking occurs
Scale out positions at multiple psychological levels
Maximize gains by understanding where demand/supply shifts
📊 Breakout Trading
Identify when price decisively breaks through major psychological barriers
Trade momentum when psychological levels are breached
Confirm breakouts using multiple level types as confluence
⚖️ Risk Management Enhancement
Calculate better risk-reward ratios using psychological levels
Size positions based on distance to next psychological level
Improve overall trading consistency
🔬 WHY PSYCHOLOGICAL LEVELS WORK:
Psychological levels are self-fulfilling prophecies in financial markets. Because thousands of traders worldwide monitor the same round numbers, these levels naturally attract significant order flow:
Order Clustering: Pending buy/sell orders accumulate at round numbers
Profit Taking: Traders instinctively close positions at psychological levels
Stop Hunts: Market makers often push price to psychological levels to trigger stops
Institutional Activity: Banks and funds use round numbers for large order placement
Pattern Recognition: Human brains naturally gravitate toward simple, round numbers
📋 TECHNICAL SPECIFICATIONS:
✓ Pine Script Version 6 (latest)
✓ Compatible with all Forex pairs (majors, minors, exotics)
✓ Works on all timeframes (M1 to Monthly)
✓ Automatic JPY pair detection and adjustment
✓ Maximum 500 lines and 500 boxes for optimal performance
✓ Levels extend infinitely across the chart
✓ No repainting - levels are fixed once drawn
✓ Efficient calculation prevents performance issues
✓ Clean visualization without chart clutter
👥 IDEAL FOR:
Day Traders: Use 100-pip and 50-pip levels for intraday setups
Swing Traders: Focus on major 100-pip levels for multi-day positions
Scalpers: Enable 25-pip and 10-pip levels for precision entries
Position Traders: Use 100-pip levels for long-term support/resistance analysis
Beginner Traders: Learn to recognize important market structure easily
Algorithm Developers: Incorporate psychological levels into automated strategies
🚀 HOW TO USE:
Add the indicator to any Forex chart
Select which level types you want to display (100, 50, 25, 10)
Customize colors to match your chart theme
Adjust zone widths based on your trading style and timeframe
Choose line style (solid, dashed, or dotted)
Watch for price reactions at the highlighted psychological zones
Use the levels to plan entries, exits, and stop-loss placement
💎 BEST PRACTICES:
✓ Combine with candlestick patterns for confirmation signals
✓ Wait for price action confirmation before entering trades
✓ Use multiple timeframes to identify the most significant levels
✓ Disable 10-pip levels on higher timeframes to reduce visual noise
✓ Enable only 100-pip levels for clean, uncluttered analysis on Daily/Weekly charts
✓ Adjust zone widths based on pair volatility (wider for volatile pairs)
✓ Use color coding to instantly recognize level importance
⚡ PERFORMANCE OPTIMIZED:
This indicator is engineered for maximum efficiency:
Smart calculation only within visible price range
Duplicate prevention system avoids overlapping levels
Optimized loops with early break conditions
Extended coverage (500 bars) without performance degradation
Handles thousands of levels across all timeframes smoothly
🎨 VISUAL DESIGN:
The default color scheme follows intuitive importance levels:
Red (100-pip): Highest importance - major barriers
Orange (50-pip): Medium-high importance - secondary levels
Blue (25-pip): Medium importance - tertiary levels
Green (10-pip): Detailed analysis - precision levels
This traffic-light inspired system allows instant visual recognition of level significance.
📚 EDUCATIONAL VALUE:
Beyond being a trading tool, this indicator serves as an excellent educational resource for understanding market psychology and how professional traders think. It visually demonstrates where the "crowd" is likely to place orders, helping you develop better market intuition.
🔄 CONTINUOUS UPDATES:
This indicator displays levels dynamically based on the current price range, ensuring you always see relevant psychological levels no matter where price moves on the chart.
✨ WHAT MAKES THIS INDICATOR UNIQUE:
Unlike simple horizontal line indicators, this advanced tool offers:
Individual customization for each level type (colors, widths)
Automatic currency pair detection and adjustment
Visual zones (not just lines) for better support/resistance visualization
Extended coverage ensuring levels are always visible
Professional color-coding system for instant level importance recognition
Performance-optimized for handling hundreds of levels simultaneously
⭐ PERFECT FOR ALL TRADING STYLES:
Whether you're a conservative position trader looking at weekly charts or an aggressive scalper on 1-minute timeframes, this indicator adapts to your needs. Simply enable the appropriate level types and adjust the visualization to match your strategy.
